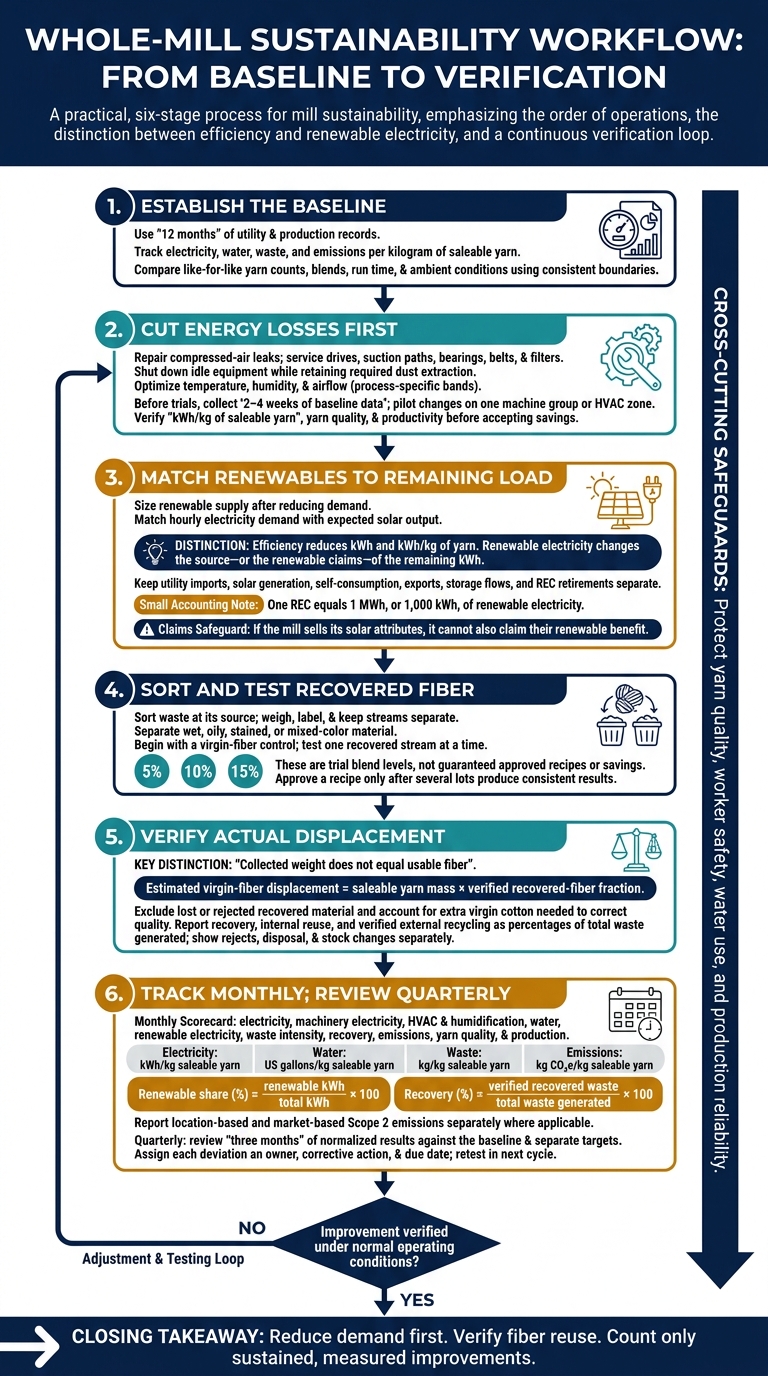
Cutting cotton spinning’s footprint starts with reducing energy use and fiber losses - not buying solar panels. Use 12 months of records to track electricity, water, waste, and emissions per kilogram of saleable yarn, then test changes without sacrificing quality, output, or worker safety.
The approach is straightforward:
- Fix energy losses first: repair air leaks, service drives and suction systems, and adjust temperature and humidity controls.
- Match renewable electricity to the remaining load: check solar costs, utility rules, and ownership of renewable energy certificates.
- Reuse fiber that passes quality tests: sort waste at its source and verify that recovered fiber replaces virgin cotton.
- Check results monthly: track energy, water, emissions, waste, and yarn quality, with assigned owners and quarterly reviews.
Lower consumption only counts as progress when the mill can verify it - and keep yarn quality and safety intact.
Sustainable Cotton Spinning: Measure, Reduce, Verify
How We Spin Colored Recycled Cotton-Polyester Yarn | OE Spinning Process
sbb-itb-0e617ca
2. Cut Machinery and Climate-Control Energy Use
Use baseline kWh/kg and waste data to identify the systems with the highest loads. Start with those systems first.
Reduce Losses in Drives, Suction, and Compressed Air
Fix measured losses before replacing equipment. Shut down idle drives, link suction to production, and use the lowest setting that still removes waste and controls fiber. Check bearings, belts, alignment, filters, lubrication, and motor load.
Survey compressed-air leaks and repair them. Then lower pressure gradually while checking critical end uses. Verify each change against kWh/kg of saleable yarn, waste removal, and yarn quality. Keep required dust extraction in place. Near 100 psig, every additional 2 psi can increase compressor energy use by about 1% at full flow.
Use this table to screen options. The dollar ranges are planning allowances - not installed-price quotes. Get local estimates before budgeting.
| Action | Energy effect | Planning cost (USD) | Maintenance and production risk | Verify with |
|---|---|---|---|---|
| Shut down idle equipment | Depends on idle hours | Minimal | Maintain safe restart procedures and required extraction | Idle-period kWh and restart reliability |
| Repair air leaks; lower excess pressure | Reduces compressor loading | Hundreds to several thousand dollars | Repeat leak surveys; low pressure can disrupt actuators | Compressor kWh, flow, and end-use pressure |
| Clean suction paths; service bearings, belts, and alignment | Reduces airflow and mechanical losses | Hundreds to several thousand dollars per machine or line | Follow manufacturer procedures; schedule downtime | Pressure drop, vibration, temperature, and motor load |
| Add VFDs and production-linked fan controls | High where load varies | Several thousand to tens of thousands of dollars per system | Check drive compatibility; excessive turndown can impair fiber removal | Fan kW, suction pressure, waste, and end breaks |
| Right-size motors and drives | Useful where loading is poorly matched | Several thousand dollars or more per system | Confirm starting torque, speed, and controls | Loaded efficiency, output, and kWh/kg |
DOE’s Nisshinbo California case study shows the potential of system-level changes: VFDs on 15 ventilation fan motors reduced demand from about 322 kW to 133 kW. Reported annual savings were approximately 1,600,000 kWh and $101,000, with a 1.3-year simple payback. These are historical project results, not a savings forecast for another mill.
Control Temperature, Humidity, and Airflow
Treat climate control as part of yarn quality control - not just a comfort system. Set process-specific operating bands rather than one millwide target. A starting range is 75–82°F (24–28°C) and 50%–55% relative humidity; validate it against your process.
Place calibrated sensors at representative machine and operator heights, away from doors, air jets, and humidifier discharge. Before increasing fan speed, balance supply and return ducts, seal leaks, and service filters, coils, nozzles, and drains. Demand-based controls must keep minimum ventilation in place for worker safety and contaminant control.
After mechanical losses fall, HVAC and humidification become the next major load.
| Option | Energy and water use | Climate suitability | Installation complexity | Hygiene and yarn-quality safeguards |
|---|---|---|---|---|
| Spray or air-washer system | Fan and pump electricity; evaporative cooling; evaporation and blowdown consume water | Most useful in dry conditions | Medium to high | Treat water, clean basins and nozzles, prevent drift, and check RH uniformity |
| Steam injection | High thermal demand; include boiler water and condensate losses | Cold or dry conditions requiring precise moisture control | Medium to high | Manage condensate and prevent wetting or condensation |
| Sensor and control upgrades | Low added energy and direct water use; can reduce unnecessary conditioning | All climates, if existing equipment has enough capacity | Low to medium | Calibrate sensors; retain RH limits and minimum ventilation |
Test Energy Savings and Yarn Quality
Collect 2–4 weeks of baseline data, then pilot changes on one machine group or HVAC zone. Meter HVAC and humidification separately. Under comparable conditions, compare yarn evenness, strength, hairiness, imperfections, end breaks, and productivity.
Track cooling valves and humidifier output together. Use deadbands and control priority to avoid cooling and humidifying at the same time unless the process requires it. Stop trials if quality, ventilation, condensation control, or worker comfort deteriorates.
Assess exhaust-energy recovery only when you can manage fouling, cross-contamination, cleaning access, and bypass control. Use the verified lower load to size renewable electricity options.
3. Add Renewable Electricity After Cutting Demand
Once demand is lower, size renewable supply to match the mill’s remaining load. Use 12 months of utility bills, production records, and available interval data to track purchased electricity, peak demand, seasonal changes, and hourly use.
Efficiency reduces kWh and kWh/kg of yarn. Renewable electricity changes the source - or the renewable claims - of the remaining kWh. A lower bill alone doesn’t prove that efficiency improved.
Assess Solar and Renewable Electricity Options
Match hourly demand and production schedules with expected solar output, rather than relying only on annual totals. Check roof or ground space, shading, roof age, structural capacity, fire access, local solar resource, inverter location, maintenance access, and utility interconnection rules.
Mills that run during the day can use more solar power directly. Mills running 24 hours should weigh storage needs against continuous spinning and humidity-control loads. Batteries can increase solar self-consumption or support critical loads, but they also add energy losses and replacement costs.
Grid-tied solar shuts off during outages unless it’s designed for islanding, typically with storage and dedicated controls. Check the utility’s export rules before sizing the system.
For utility renewable-electricity programs, power purchase agreements, and unbundled renewable energy certificates (RECs), compare covered MWh, contract length, price premium, generation region, and REC ownership. One REC equals 1 MWh, or 1,000 kWh, of renewable electricity. Require records showing who retires the certificates. Paying for electricity doesn’t automatically transfer its renewable attributes.
Compare Project Costs and Check Emissions Claims
After checking technical fit, compare costs and emissions claims using the same accounting rules. Get site-specific quotes instead of relying on generic installed prices. Include engineering, structural work, interconnection, maintenance, financing, and replacements.
Value solar used on-site at the applicable avoided electricity purchase cost. Value exports at the utility’s actual export rate - not an assumed retail rate.
| Option | Lead time | Capital cost or annual commitment (USD) | Production effect | Annual electricity outcome | Cost and emissions screening |
|---|---|---|---|---|---|
| Efficiency projects | Weeks to months; longer for major equipment | Site-quoted investment in $ | Verify throughput and yarn quality | Metered kWh saved/year | Payback and lifecycle cost; savings × applicable emissions factor |
| On-site solar | Approximately 6–18 months; interconnection may take longer | Site-quoted $/installed kW and total $ | Plan installation outages and electrical testing | kWh generated, self-consumed, and exported/year | Include export revenue, degradation, and maintenance; assess emissions under the chosen accounting method |
| Renewable procurement | Weeks to months for programs or RECs; PPAs need further negotiation | Annual $ premium or contract commitment; often low upfront capital | No direct machinery effect | Qualifying MWh purchased and retired/year; no physical energy savings | Compare full contract cost; eligible instruments can lower market-based Scope 2 emissions |
Each month, reconcile utility imports, solar generation, self-consumption, exports, and storage flows. Track imports, generation, exports, and REC retirements separately in the scorecard. Don’t count exported electricity as mill use.
Report both location-based and market-based Scope 2 emissions when qualifying contracts exist. Use grid-average factors for location-based reporting and eligible supplier and contractual data for market-based reporting. Record the method, factor source, and reporting year, and keep invoices, meter data, contracts, and retirement records. If the mill sells its solar attributes, it cannot also claim their renewable benefit.
4. Recover Spinning Waste and Reduce Virgin Fiber Use
Sort and Track Waste at the Source
After cutting energy use, focus on fiber losses. The goal is less virgin cotton per kilogram of saleable yarn, not just a cleaner mill. Check rising losses by machine and shift, and separate waste by reuse potential before storage. Track each process stream separately: mixing clean fiber with floor waste can lower its quality.
Use covered, labeled containers, dedicated collection routes, and clean handling equipment. Weigh each stream at collection. Label bales with the source machine, waste type, date, shift, lot, composition, weight, moisture condition, and intended reuse route. Store bales off the floor in a dry area. Keep wet, oily, stained, or mixed-color material separate.
| Source | Quantity to record | Quality classification | Permitted reuse route | Rejected fraction | Final destination |
|---|---|---|---|---|---|
| Carding waste | lb or kg/shift; kg/kg yarn | Clean, short-fiber-rich, or contaminated | Blend into approved low- or medium-count yarn recipes after testing | Oil, metal, plastic, excessive trash | Fiber recycler or approved disposal |
| Card flat strips | lb or kg/shift; kg/kg yarn | Clean, short-fiber-rich, or contaminated | Blend into approved low- or medium-count yarn recipes after testing | Contaminated or unsuitable fiber | Fiber recycler or approved disposal |
| Comber noils | lb or kg/shift; kg/kg yarn | Relatively clean but often high in short fibers | Controlled blending, nonwoven products, or external fiber recycling | Excessive neps, trash, or moisture | Recycler or disposal |
| Pneumafil | lb or kg/shift; kg/kg yarn | Fine, potentially reusable fiber with variable contamination | Small, validated recipe additions or external recycling | Dust, foreign matter, wet material | Recycler or disposal |
| Winding waste | lb or kg by yarn style and color | Yarn waste, clearer cuts, or package waste | Reprocessing where technically suitable; otherwise external recycling | Oil, mixed colors, foreign materials | Recycler or disposal |
| Sweepings | lb or kg by area | Low-confidence, mixed, and contamination-prone | Usually restricted from high-quality yarn recipes | Floor debris and nontextile contaminants | External recycler or disposal |
| Nontextile contaminants | Count and weight by type | Metal, plastic, paper, rubber, or packaging | No fiber reuse | Entire stream | Specialized recycling or disposal |
Test each separated stream on its own before blending it into production.
Test Recovered Fiber and Measure Actual Reuse
Set acceptance limits for fiber length, short-fiber content, neps, contamination, moisture, color, fineness, and blend composition based on yarn count, spinning system, and customer specifications. Retain lot samples and keep separate recipes for each waste stream. Repeated mechanical processing can shorten fibers, so collected weight does not equal usable fiber.
Start with a virgin-fiber control, then test one recovered stream at a time. Run trials at 5%, 10%, and 15% recovered fiber while keeping machine settings and production conditions constant. Record machine settings and conditioning. Compare strength, elongation, unevenness, imperfections, hairiness, end breaks, productivity, and customer-required fabric performance. Review trials daily, and approve a recipe only after several lots produce consistent results.
Use these records to check whether recovered fiber actually reduces virgin fiber use.
Report monthly waste intensity as waste per unit of saleable yarn, using kg/kg or lb/lb. Each month, reconcile weigh tickets, recipes, batch records, and stock changes. Report recovery, internal reuse, and verified external recycling as percentages of total waste generated. Show rejects, disposal, and stock changes separately.
Estimate virgin-fiber displacement by multiplying saleable yarn mass by the verified recovered-fiber fraction. Exclude recovered material that was lost or rejected, and account for any extra virgin cotton needed to correct quality. A collected bale alone does not prove productive reuse; verify actual virgin-fiber displacement and external recycling.
5. Conclusion: Verify and Maintain Results
Once the physical changes are in place, move from project work to routine checks. Verify each change under normal operating conditions before counting the savings. Lower energy use must not come at the expense of water use, yarn quality, production reliability, or safety.
Track Results with a Monthly Scorecard
Track absolute totals and normalized indicators for energy, waste recovery, emissions, and quality each month. Compare like-for-like yarn counts, blends, run time, and ambient conditions, using consistent production and accounting boundaries. Set separate targets for machinery, HVAC, renewable electricity, and recovery so progress in one area doesn’t hide losses in another.
| Indicator | Monthly measure |
|---|---|
| Total electricity | Total kWh/kg of saleable yarn |
| Machinery electricity | Machinery kWh/kg of saleable yarn, excluding HVAC |
| HVAC and humidification | Climate-control kWh/kg of saleable yarn |
| Water | US gallons/kg of saleable yarn |
| Renewable electricity | Renewable share of electricity: renewable kWh ÷ total kWh × 100 |
| Waste intensity | kg of process waste/kg of saleable yarn |
| Recovery | Verified recovered waste ÷ total waste generated kg × 100 |
| Greenhouse gas emissions | kg CO₂e/kg of saleable yarn, reported by scope with the factor source stated |
| Yarn quality | Strength, evenness, imperfections, end breaks, and customer returns |
| Production | Saleable kg, machine hours, and utilization |
Where applicable, report location-based and market-based Scope 2 emissions separately. Use the correct EPA eGRID factor for location-based reporting and qualifying contract records for market-based reporting. Keep utility bills, contracts, certificates, the factor version, and the calculation date.
Use the scorecard to assign ownership and trigger corrective action when results drift.
Assign Responsibilities and Review Quarterly
Assign owners for metering, HVAC, maintenance, production, quality, environmental reporting, and approval. Give each owner a reporting deadline and an escalation limit. Before approving results, reconcile electricity submeters with utility bills.
Monthly tracking needs more than data: each metric needs someone who checks it and acts promptly when performance slips.
Each quarter, review three months of normalized results against the baseline and the separate targets. Check yarn quality and production uptime alongside those results. For every deviation, assign an owner, a corrective action, and a due date, then retest in the next cycle.
Close an action only after the improvement holds without higher water use, weaker yarn quality, lower reliability, or safety issues.
FAQs
Which sustainability upgrades should my mill prioritize on a tight budget?
Start with low-cost process improvements, rather than replacing entire machines. Insulation offers the fastest return on investment. Fine-tune carding suction hood gauges to cut fiber waste, and adjust suction systems to prevent excess energy use.
Add variable frequency drives (VFDs) to existing suction fans and motors so energy use matches demand. This often saves 15%–20% in energy use. Keep relative humidity at 60%–65% to reduce yarn breakage and fiber waste.
How can I compare energy savings across different yarn counts?
Track total energy use in kilowatt-hours (kWh) per kilogram of yarn produced. Finer yarns typically use more energy, so compare energy per kilogram at specific yarn counts, such as Ne 30 or Ne 60, to keep comparisons consistent.
Use digital tools or ERP systems to monitor these figures consistently. Compare them with historical data or global standards to find ways to improve efficiency across your yarn range.
How much recovered fiber can I reuse without affecting yarn quality?
Mills can often blend up to 20% recycled fiber with virgin fiber without retooling, commonly in open-end spinning systems. How much you can reuse without reducing yarn quality depends on your equipment and target yarn count.
To keep quality consistent, blend bales to even out fiber properties. Use automated sorting to manage fiber length and contaminants.