Cotton compliance in 2026 is no longer a once-a-year job. If I grow cotton or run a gin, I now need field logs, energy records, and bale traceability to keep access to programs, buyers, and better pricing.
Here’s the short version:
- Federal programs like EQIP and CSP now tie payments to recorded gains in water use, soil health, and nutrient use.
- Large buyers want verified data on water, energy, and greenhouse gas emissions.
- The U.S. Cotton Trust Protocol has grown to 2.58 million acres and 1,512 grower members, with year-over-year gains of 18% in acres and 14% in membership.
- Growers in the program must report data on six field metrics for at least 10% of cotton acres.
- Gins are under more pressure to track kWh per bale, fuel use, and bale-level IDs.
So what does that mean in plain English?
It means I can’t rely on paper notes and scattered spreadsheets anymore. I need tools that log work as it happens:
- Irrigation monitoring for water records
- Precision application tools for input records
- Traceability software for bale tracking
- Emissions platforms for farm and gin reporting
- Gin energy monitoring and equipment upgrades to cut power use
A few numbers show why this is moving fast:
- NRCS nutrient records may need to be kept for at least 5 years
- Sensor-based irrigation can use fixed triggers like 50% plant-available water
- Some gins report about 33 to 41 kWh per bale
- VFDs can cut controlled-load electricity use by 10% to 30%
My takeaway: the main shift is simple. Policy now asks for proof, not broad claims. And that is why cotton farms and gins are putting more money into data systems, field sensors, software, and gin controls.
If I were turning this into an action plan, I’d start here:
- List each rule or buyer request I have to meet
- Match it to a data point I need to record
- Pick the tool that records that data with the least manual work
- Focus first on systems that help with both compliance and day-to-day cost control
That’s the core of this article: policy pressure is pushing cotton businesses toward better recordkeeping, tighter tracking, and more connected farm-to-bale systems.
The compliance challenge: which cotton policies are driving change
Standards and programs that require measurable results
Cotton compliance has changed. Today, programs want field-level and bale-level records, not broad sustainability statements.
The U.S. Cotton Trust Protocol (USCTP) is a big part of that shift. It is the first cotton fiber program to offer bale-level traceability, and it requires growers and gins to track six measured metrics: land use, soil health, water management, greenhouse gas emissions, energy use, and fiber quality. Those metrics must be checked by an independent body such as Control Union Certification. In plain terms, that moves compliance away from general claims and toward numbers that can be reviewed. USCTP also uses Field to Market data to document field-level impacts for buyers and auditors.
EQIP and CSP work the same way. They require documented conservation practices and outcome records, including nutrient applications, irrigation logs, and soil data. Under Nutrient Management Code 590, NRCS guidance says producers must keep nutrient application records for at least five years, including dates, quantities, methods, weather conditions, and soil moisture. The U.S. Climate Smart Cotton Program adds field-level MMRV for greenhouse gas outcomes and soil carbon, using satellite imagery, automated devices, and third-party audits.
Put all that together, and the direction is pretty clear: growers and gins are being pushed to move beyond paper files and into sensors, software, and automated logs.
What compliance looks like in daily work
Compliance is no longer something you deal with only when an audit shows up. It has become part of the everyday job.
For growers, that means recording irrigation, inputs, field location, weather, and conservation practices as work happens. NRCS guidance specifically recommends flow meters, soil moisture probes, and PET (potential evapotranspiration) data for irrigation scheduling. It also expects records of application dates, materials, and rates to be kept and ready for review. On top of that, conservation plan records, soil test results, and crop yield data need to stay organized and easy to pull.
At the gin, the work is just as hands-on. Compliance means tracking incoming lots, documenting bale IDs through the Permanent Bale Identification (PBI) system, logging energy use, recording dust-control checks, and keeping worker safety records up to date. If the operation is part of a sustainability program, staff may also need to upload records into a platform, fix mismatches, and keep backup documents in order for outside auditors.
That’s why many operations start with tools that automate irrigation and application records. It’s often the first place where paperwork starts to pile up.
What goes wrong when records stay manual
Manual recordkeeping creates problems fast. Paper logs get filled out late. Spreadsheets end up with gaps. Someone saves a second or third version, and now the numbers don’t match.
That becomes a serious issue because programs such as USCTP, EQIP, and climate-smart efforts require audit-ready documentation tied to a specific farm, field, gin, or bale and checked against a set standard. If that record trail is missing or messy, the downside is very real: missed incentive payments, delayed certification, and weaker standing with buyers who want verified data.
There’s a staffing cost too. People spend hours collecting notes, checking entries, and typing the same information into more than one system instead of running the operation. And if a buyer or program manager asks for performance data on short notice, a manual setup can drag out the response. Sometimes that delay is enough to lose a contract or miss out on preferred-supplier status.
The next move for many operations is straightforward: replace manual logs with systems that collect data while the work is being done.
sbb-itb-0e617ca
Water and input efficiency: tools for irrigation and precision application
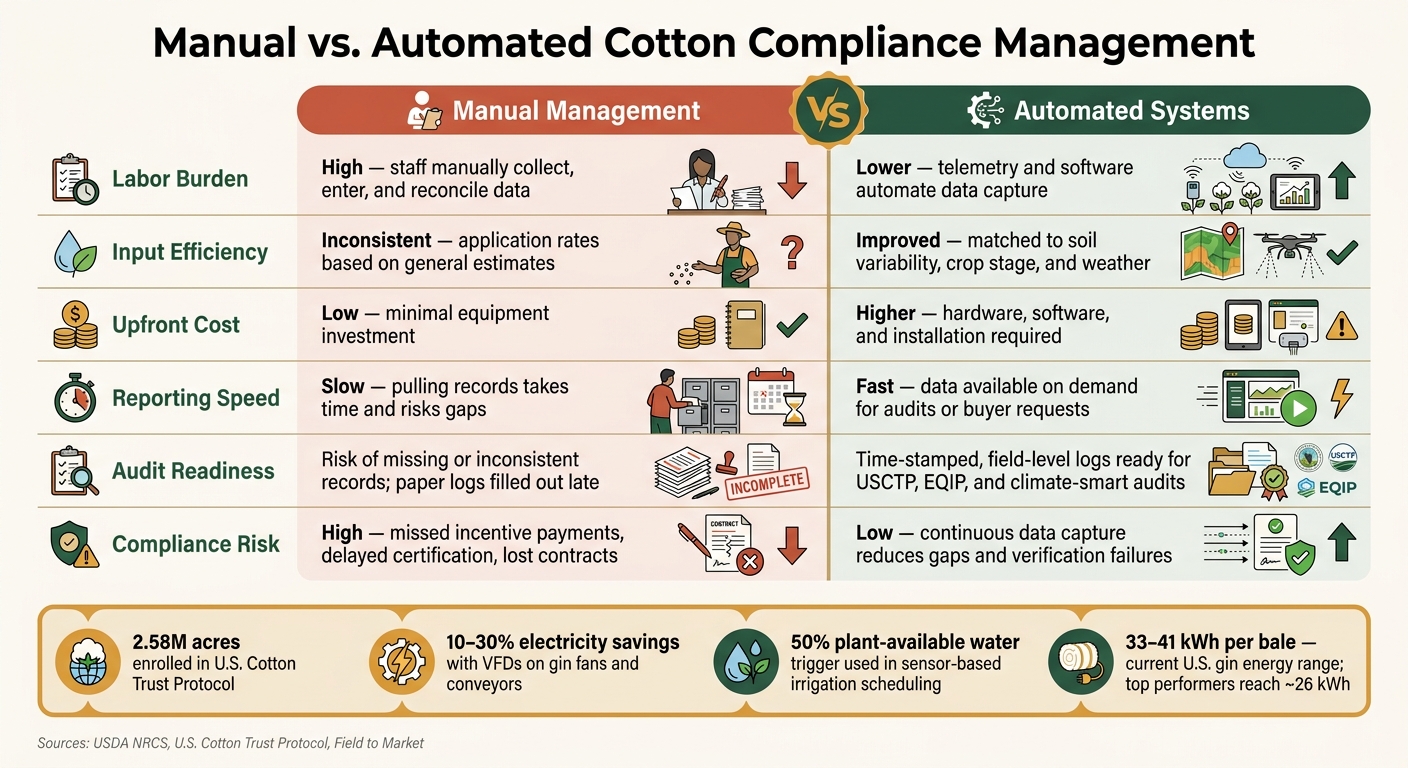
Manual vs. Automated Cotton Compliance: Key Differences at a Glance
Water-use monitoring systems that create audit-ready records
Measured irrigation does two jobs at once: it helps save water, and it builds records you can actually use during an audit. For cotton, a practical setup usually includes soil moisture probes, pump or pivot flow meters, telemetry, and irrigation scheduling software. Soil moisture probes show when the crop needs water, which is a lot better than relying on what the field looks like from the turnrow. USDA NRCS standards call for sensors at at least two depths in the soil profile, using tools such as capacitance sensors, tensiometers, or granular matrix sensors, so growers can see how water moves through the root zone.
Flow meters show exactly how many gallons moved through a pump or pivot during each irrigation set. Telemetry sends those readings automatically, which means no one has to jot them down by hand at the end of a long day. Scheduling software then turns that stream of data into time-stamped logs. That matters because when someone asks what happened, when it happened, and how much water was used, the answer is already there.
In Mississippi Delta trials, the trigger was very specific. Sensor-based scheduling in cotton fields started irrigation only when plant-available water dropped to about 50%, giving growers a clear rule for each irrigation call. In other trials, Watermark sensors placed at 8, 16, and 24 inches started irrigation when soil tension reached −40 centibars. Those thresholds take a lot of the guesswork out of irrigation.
The same idea carries over to precision application.
Precision application equipment that cuts waste
Variable-rate irrigation (VRI) is one of the clearest examples. Instead of putting the same amount of water across the whole pivot, VRI changes the rate zone by zone based on soil type, crop stage, and moisture data. In cotton research from the Texas High Plains, lint yield increased by 2–4% when growers used management zones with variable-rate irrigation instead of uniform irrigation. On large acreages, that kind of lift adds up fast.
The same approach works with fertilizer and pesticide application. When rates match actual field conditions, growers can avoid putting too much product in wetter or stronger areas while still giving weaker parts of the field the support they need. It’s a more exact way to manage inputs, and it leaves a cleaner paper trail.
For sustainability programs, that paper trail matters just as much as field performance. For growers, it matters just as much as the yield bump. A system that records what was applied, where it was applied, and when it happened gives clear proof of efficient input management.
Cost, payback, and funding options
These systems do require upfront spending. But they can cut costs tied to water, fuel, power, inputs, and reporting. When looking at payback, compare hardware, software, installation, training, and reporting labor against savings in water, diesel, electricity, and crop inputs. Reporting labor often gets missed in this math, even though it can be a real expense on larger farms. If a system logs irrigation events on its own and builds reports for you, that can save a lot of manual entry time.
USDA conservation programs, including EQIP, may cover part of the cost when the equipment supports documented conservation results such as lower water use or better nutrient efficiency. Before buying anything, check local NRCS and extension rules, since reimbursement changes by state and district. Funding is usually tied to a conservation plan, so the purchase should connect to a clear improvement target and a recordkeeping process from day one.
The table below shows the practical differences between manual management and an automated setup across the issues that matter most for compliance and day-to-day farm work.
| Factor | Manual management | Automated |
|---|---|---|
| Labor | High - staff manually collect, enter, and reconcile data | Lower - telemetry and software automate data capture |
| Input efficiency | Inconsistent - application rates based on general estimates | Improved - matched to soil variability, crop stage, and weather |
| Upfront cost | Low - minimal equipment investment | Higher - hardware, software, and installation required |
| Reporting speed | Slow - pulling records takes time and risks gaps | Fast - data available on demand for audits or buyer requests |
Once field data is automated, the next move is connecting it to bale records, gin emissions, and energy reporting.
Traceability, emissions, and gin upgrades: the next systems to put in place
Traceability software linked to bale-level records
At the gin, field records need to turn into bale-level traceability, emissions logs, and energy data. That starts with giving each bale its own ID, such as a barcode, RFID tag, or QR code. The ID should be recorded when seed cotton enters the gin, during processing, and again when lint bales are pressed and stored.
Good traceability software connects that bale ID back to the farm it came from. It can also tie in field location, variety, harvest date, gin date, HVI quality data like staple length and micronaire, plus sustainability metrics pulled in from farm management platforms.
State rules make organized recordkeeping more than a paperwork issue. Virginia’s statute, for example, requires gins to record consignor identity, intake date, lot identifiers, sequential bale tags, finished bale weight, grade, and itemized charges. Alabama rules require bale labels to show the ginner’s permit or federal gin code along with a consecutive bale number. A digital system turns all of that into searchable, exportable records that are much easier to share with regulators, mills, and brand customers.
Programs like the U.S. Cotton Trust Protocol go a step further. They connect bale-level traceability with farm-level metrics such as soil health, water use, and greenhouse gas estimates, so the data tied to each bale can be verified. For a gin trying to become a preferred supplier for a major apparel brand, that field-to-bale link is starting to look less like a bonus and more like the floor.
Once those bale records are set up, the next layer is emissions reporting.
Emissions tracking platforms for farm and gin reporting
Emissions tracking platforms pull together fuel, electricity, gas, and fertilizer data to estimate CO2e per acre or per bale. Tools like Field to Market's Fieldprint Platform, COMET-Farm, and the ICAC Carbon Footprint App are examples of the standard models used for this kind of reporting.
In practice, the workflow is pretty straightforward. A grower logs fuel and fertilizer use by field. The gin uploads monthly electricity data. The platform then calculates outputs like kilograms of CO2e per bale and shows where the biggest emissions hot spots sit, whether that’s nitrogen use or drying that eats up a lot of power. Most of these systems also produce dashboards, exportable reports for climate-smart programs, and summaries that brand sustainability teams can actually use.
Adoption is moving for a few clear reasons:
- Climate-smart commodity programs tie incentive payments to measured emissions cuts against a baseline, and approved tracking tools are part of the deal.
- Brands and retailers are asking for bale-level carbon data for reporting and product claims.
- Gins and growers are getting direct use from the numbers themselves. If you want to know whether an equipment upgrade paid off, you need to compare your kWh-per-bale figure before and after.
The U.S. Cotton Trust Protocol reports that energy use intensity among participating operations has stabilized at about 28% below baseline. That’s the kind of result that only shows up when tracking happens year after year.
The most direct path to lower reported emissions is usually lower gin electricity use.
Energy-efficient gin equipment and process monitoring
Ginning makes up roughly 6–17% of total cotton GHG emissions across the full life cycle, while fertilizers and field fuel account for the rest. In the United States, gins now report electricity use of about 33 to 41 kWh per bale, with monitored operations averaging around 35.8 kWh per bale. Some leaner operations have reached about 26 kWh per bale through better throughput and tighter equipment control.
The first step is energy monitoring. Once you can see where power is going, upgrade decisions get a lot easier. It’s hard to fix what you can’t measure.
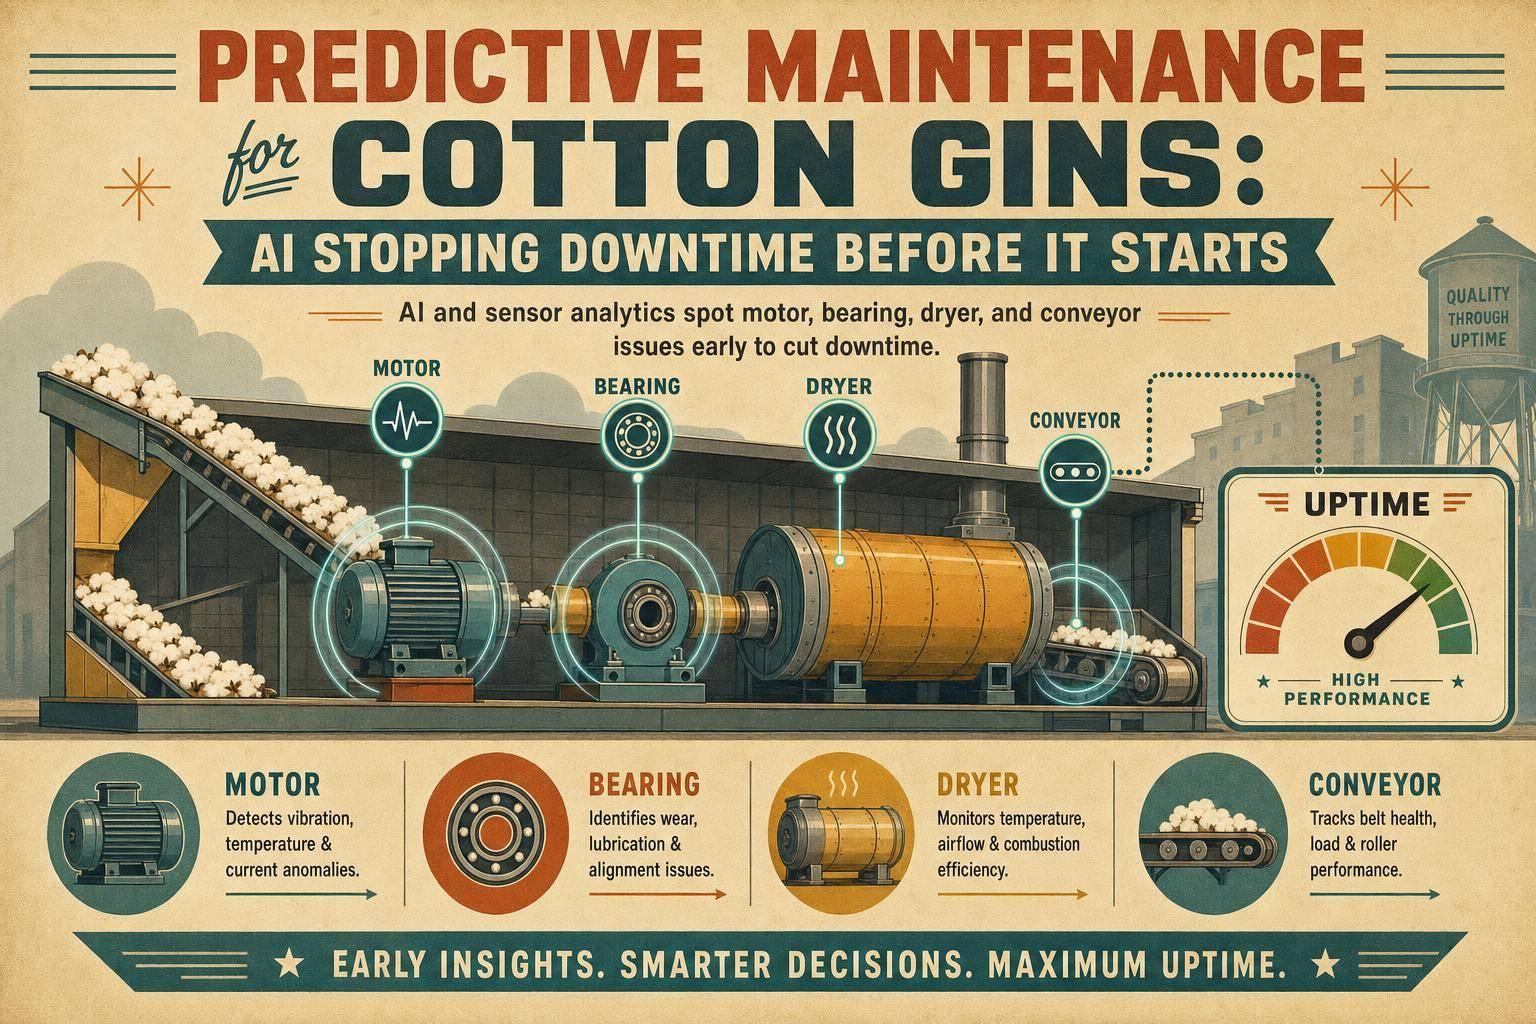
For many gins, VFDs on fans and conveyors are the best place to start. They often have the shortest payback and give clean documentation for compliance work, while cutting electricity use by 10–30% on controlled loads. After that, motor replacements and dryer upgrades can come next, usually during the off-season so downtime stays manageable.
It also helps to check outside funding before locking in a capital plan. Utility rebates and USDA conservation program support can improve the math on these projects and change which upgrade makes sense to do first.
Conclusion: turning policy pressure into a clear technology plan
In 2026, sustainability compliance is part of day-to-day cotton work: irrigation, input use, gin energy, and bale traceability. So the next step isn’t debating policy. It’s putting the right systems in place.
The path is pretty direct. Start with the policy rule or buyer demand that affects your operation. Then turn that requirement into a specific data need. After that, match each data need to one tool for growers and gins - whether that’s an irrigation scheduling system, an emissions tracking platform, or traceability software that connects field records to bale IDs. Precision tools are already common across U.S. cotton, so now the job is to tie those systems to compliance data.
Once those data needs are defined, run every project through two filters:
- Compliance impact: Does the system directly support a required metric like water use, emissions, or traceability?
- Efficiency impact: Does it produce measurable savings, such as lower energy per bale or fewer irrigation passes?
Tools that perform well on both - energy monitoring, irrigation scheduling, and traceability software - should move to the top of the list. From there, use a simple payback test and include cost-share funding where it applies.
Manual recordkeeping is still the biggest drag. Paper logs are hard to pull together, easy to lose, and they often don’t have the time-stamped detail needed for verification. That slows audits, adds labor cost, and hurts standing with preferred supplier lists that expect documented performance.
For growers and gins, the takeaway is straightforward: rules are getting tighter, and the smart response is a technology plan built around compliance, efficiency, and traceability. That’s how operations protect access to buyers, programs, and premiums as expectations keep climbing.
FAQs
Which cotton operations are affected first?
Cotton farms and ginning operations feel these pressures first.
They’re on the front line of regulatory compliance and sustainability demands. And because these early supply chain stages handle traceability and accurate data collection, they face the most immediate push to use digital tools, keep chain-of-custody records up to date, and line up with ESG frameworks to stay compliant and competitive.
How do I choose the first compliance tech to buy?
Start with a cost-benefit analysis to make sure the investment lines up with your long-term goals. Then look at your current systems and spot any gaps in data collection or reporting that make compliance harder.
Next, pick technology that targets your biggest weak spot, like water loss or emissions tracking. Ask for a demo so you can check that it works with your existing equipment.
What records should I digitize before an audit?
Digitize records that show compliance, day-to-day accuracy, and chain of custody. That means permits, air emissions data, waste disposal records, water-use logs, and equipment maintenance and calibration certificates.
You’ll also want clean, organized traceability and warehouse records. This includes bale ID numbers, PBI tags, field locations, harvest dates, weight tickets, training and safety logs, daily movement logs, inventory reports, classification codes, and shipping and customs documents.