If you grow cotton in 2026, the main play is simple: start with autosteer, use field data to trim seed, nitrogen, and water by zone, and track ROI by field.
I’d sum up the article like this: cotton precision ag pays when it cuts overlap, avoids input waste, and helps time irrigation, PGRs, defoliation, harvest, and gin intake with better data. The fastest returns tend to come from GPS guidance, section control, and variable-rate application, while see-and-spray usually needs 13,000 to 20,000 acres and herbicide costs above $10 per acre to work on paper.
A few numbers stand out:
- 86% of U.S. cotton growers used autosteer in 2023
- 50% of test sites showed no yield response to added nitrogen
- Dynamic irrigation zones improved water productivity by 19%
- Using three precision tools together has been tied to $30 to $80 more net return per acre
If I were putting this into one clear plan, it would be:
- Start with autosteer if you do not already use it
- Build starter zones with soil maps, yield maps, and NDVI
- Use data to adjust seed, nitrogen, and irrigation
- Train operators to keep data clean
- Measure seed cost, fertilizer use, irrigation hours, fuel, lint yield, and field-to-gin turnaround time
Here’s the short version of what each tool is best at:
| Tool | Main use | Where payback tends to show up |
|---|---|---|
| Autosteer / GPS | Keep passes on line | Less overlap, less fatigue, fewer skips |
| Section control | Shut sections on and off by area | Lower over-application |
| VRT | Change rates by zone | Better control of seed, N, and water spending |
| Drones / satellites | Watch crop stress and canopy changes | Better timing for irrigation, PGRs, defoliation |
| Yield mapping | Show field-by-field performance | Better next-season decisions |
| See-and-spray | Spray only where needed | Mostly for large-acre systems |
Bottom line: I would not treat precision ag as a full-farm tech project. I’d treat it as a step-by-step cost control plan for cotton fields and gin flow.
Top Precision Agriculture Tools for Cotton Production
GPS Guidance, Autosteer, and Yield Mapping
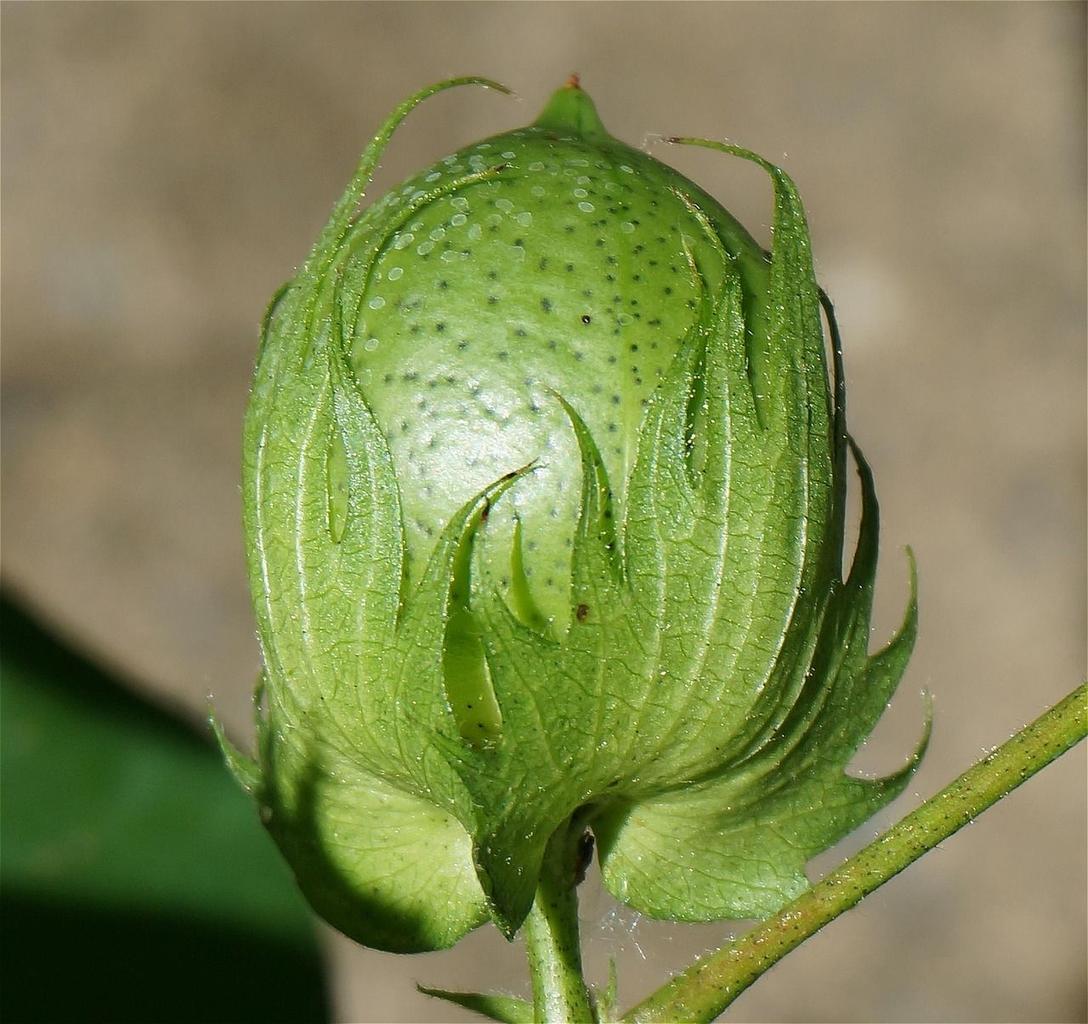
Autosteer helps keep planting, spraying, and harvesting on row. That means fewer overlaps, fewer skips, and less operator fatigue, all without much setup. In cotton, the return often shows up early: cleaner passes at planting and spraying, then better harvest data later on.
Yield monitors built into module-building harvesters show which parts of a field perform well and which ones lag. That gives growers a starting point for year-to-year decisions. But those maps only pull their weight when growers use them to adjust rates, time irrigation, and plan harvest.
Variable-Rate Application, Soil Sensors, and Precision Irrigation
Variable-rate application uses yield and soil data to change seed and fertilizer rates by zone instead of spreading one flat rate across the whole field. For cotton, the biggest gains usually come from managing three inputs by zone:
- Seed
- Nitrogen
- Water
Cotton Incorporated reports that growers can go as low as 15,000 evenly spaced plants per acre without hurting yield, as long as spacing stays consistent.
A two-season cotton study showed what this can look like in practice. Weekly drone NDVI and thermal imagery were used to build dynamic management zones on a variable-rate center pivot. The result: water productivity increased 19% over uniform irrigation, compared with 12% for static zones. Drones and satellites also help check whether those zone-based calls are working during the season.
Drones, Satellite Imagery, and Farm Data Platforms
Drones and satellites make scouting a lot easier across large acreages. They can spot canopy stress, stand gaps, and irrigation issues faster than field checks alone. NDVI and thermal imagery track canopy vigor and lint-yield potential through the season. Growers can also use that same imagery to better time PGRs, defoliation, and irrigation, with less guesswork.
In April 2026, Texas A&M AgriLife used near-daily canopy and health maps from 11 Coastal Bend producers to guide plant growth regulator timing and defoliation.
"Our tools integrate drone-based and satellite remote sensing data to estimate key plant features, creating digital twins of key production scenarios." - Juan Landivar, Ph.D., Director of the Texas A&M AgriLife Research and Extension Center at Corpus Christi
Farm data platforms pull imagery, sensor readings, field history, and harvest results into one place. On paper, that sounds neat. In the field, it only matters if that data helps growers make better in-season calls, cut input waste, and avoid harvest slowdowns. The next step is figuring out which tools deliver the fastest payback in input savings, labor, and harvest efficiency.
sbb-itb-0e617ca
Looking at Precision Ag Adoption in Cotton
ROI: Where Precision Cotton Systems Save Money and Add Value
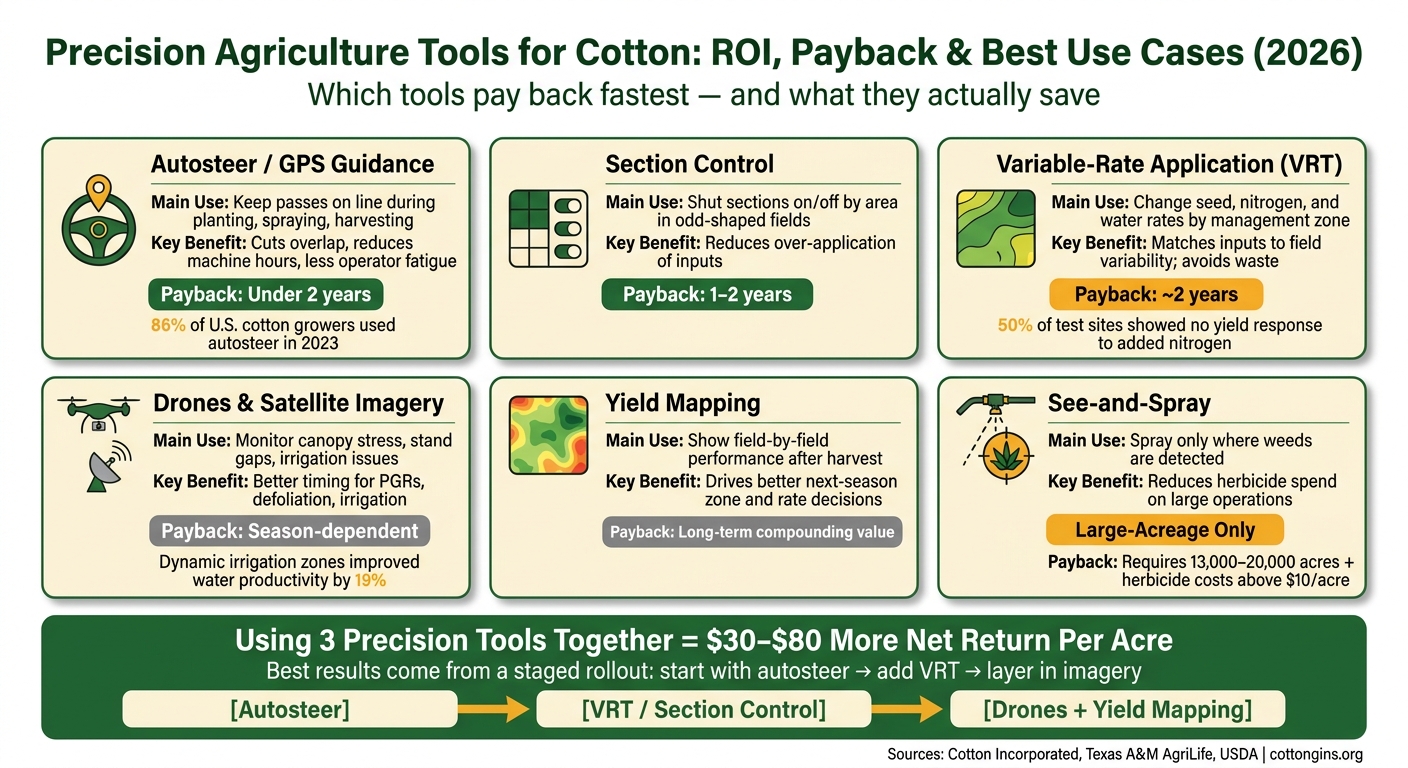
Precision Agriculture Tools for Cotton: ROI, Payback & Best Use Cases
Direct Input Savings by Tool Type
Autosteer, section control, and variable-rate application save money in a pretty direct way. They cut overlap, trim fuel use, reduce machine hours, and lower spending on seed, fertilizer, and water when field maps show real variability from one area to another.
Nitrogen is a good example. Deep soil nitrate tests can show when residual nitrogen is already doing the job. In one set of research, 50% of tested sites had enough existing soil nitrogen to maximize yield without extra applications. That matters, because adding more product in those cases just adds cost.
Seeding rates can also come down, but there's a catch: lower rates only pay off when spacing and stand uniformity stay steady. If emergence gets uneven, the savings can disappear fast.
Irrigation is another area where timing matters. Soil and moisture sensors help growers make better calls on when to water, which can cut pumping costs and avoid watering at the wrong time.
The next step is figuring out how long it takes for those savings to pay back the setup cost.
Payback Periods, Cost Ranges, and What Affects the Numbers
Payback changes a lot from one farm to the next. Acreage matters. Field variability matters. What equipment you're already using matters too. In plain terms, not every tool pencils out on every operation.
See-and-spray systems are a good case in point. They usually need herbicide costs above $10 per acre and total acreage in the 13,000 to 20,000 acre range before the math starts to work in a grower's favor.
A simple way to look at ROI is to tie each tool to the main cost it cuts:
| Tool Category | Typical Savings/Benefit | Likely Payback Horizon |
|---|---|---|
| Autosteer / GPS Guidance | Cuts overlap and machine hours | Under 2 years |
| Section Control | Reduces over-application in odd-shaped fields | 1–2 years |
| Variable-Rate Application (VRT) | Matches inputs to field variability | Around 2 years |
| See-and-Spray | Targets herbicide where needed | High-acreage dependent (13,000–20,000 acres) |
Input prices put even more pressure on that timeline. When fuel and fertilizer costs climb, cotton breakeven can move up fast, which leaves less room for tools with a slow return.
Those same data streams can also help with a very different part of the operation: getting cotton through the gin.
Gin and Harvest Logistics Gains
Precision data isn't only about field passes and input rates. It also helps at the gin. Yield monitors and module tracking give gins an earlier read on harvest volume and fiber flow, which helps with intake scheduling and labor planning.
Implementation Steps for Growers and Gin Stakeholders
Assess Readiness and Pick the First High-Impact Tools
Once you've looked at ROI, the next move is pretty straightforward: start with the tools that are easiest to put to work and easiest to expand later.
Before you buy anything, look at what you already own. Check whether tractors and harvesters have GPS and whether they can send data wirelessly. Wireless modems can cut out the hassle of swapping memory cards, which saves time during fieldwork.
A good place to start is autosteer. Most newer machines already include it, and it doesn't take much setup. Just as important, it gives you the baseline data needed for zone maps and rate decisions.
From there, use SSURGO soil maps and Landsat or Sentinel NDVI to set up starter zones with data you likely already have. The point is simple: spend less in parts of the field that don't respond much, and spend more where the return is there.
Build Precision Workflows from Pre-Season Through Harvest
A basic precision workflow fits neatly into the cotton season:
| Season Phase | Key Data Source | Decision |
|---|---|---|
| Pre-Season | Soil electrical conductivity (ECa), topography, historical yield maps | Delineating management zones |
| Planting & Vegetative | GPS guidance, NDVI drone/satellite | Site-specific seeding, PGR timing |
| Reproductive & Harvest | Thermal imaging (crop water stress index, CWSI), yield monitors | Dynamic irrigation, harvest scheduling, intake scheduling |
Static zones are set before planting with soil and topography data. Dynamic zones shift week by week based on drone or satellite imagery, which helps fine-tune irrigation and plant growth regulator (PGR) applications as field conditions change.
For gins, early-season biomass data and lint yield forecasts make arrival volume and timing easier to estimate. That helps with intake scheduling and labor planning before harvest starts.
Train the Team and Track Results by Field and Season
For gins, these same records also help with intake timing and labor planning. But here's the catch: tools don't pay off if operators don't use them the right way, every time. One of the biggest roadblocks is limited training with digital tools.
Put the focus on hands-on training for equipment operators, especially around data collection. Keep the process simple. Set standard protocols so yield monitor data stays clean, and remove outlier readings caused by speed swings so ROI numbers don't get skewed.
It helps to frame training as ROI protection. Clean data, correct application, and better season-over-season comparisons all depend on it.
Track a small set of KPIs each season so the team can see what changed without getting buried in reports:
- seed cost per acre
- fertilizer use per acre
- irrigation hours
- fuel use
- lint yield
- field-to-gin turnaround time
That gives you a clear before-and-after view by field and by season.
Conclusion: A Practical 2026 Precision Ag Plan for Cotton
Precision ag pays off when it solves a clear cost issue: overlap, input waste, irrigation, or harvest timing.
The next step isn't debating whether the tools work. It's figuring out how to roll them out without burning cash. The best path is simple: start with one baseline, add one tool, measure the result, then expand. Using three precision tools together has been linked to $30 to $80 more net return per acre, but that payoff tends to come after a staged rollout.
"Start with one tool, prove it works on 100 acres, then expand. That is how you build confidence and real ROI." - Mark Thompson, independent agronomist
Training is what turns precision tools into ROI. Clean yield data, correct prescriptions, and calibrated equipment make the difference between a system that helps and one that just adds cost.
That same discipline should carry over to the gin. Use cottongins.org to line up harvest timing, module movement, and gin intake with the season's precision workflow.
FAQs
What precision ag tool should I buy first for cotton?
Start with GPS-guided equipment. In many cases, that means an auto-steer system paired with a properly calibrated planter.
Why start there? It’s often the easiest precision upgrade to put in place. It can improve planting consistency and gives you a solid base for variable-rate seeding and later site-specific inputs.
For cotton, GPS field mapping can support variable-rate seeding and often cut seed use by 10%–15%. And when you calibrate planting depth to 0.5–0.75 inches, you’re more likely to get even emergence.
How many acres do I need for precision ag to pay off?
The break-even point for precision ag is usually around 100 to 200 acres. If you're running a smaller farm, that doesn't mean you're shut out. You can still get good results with free apps and shared drone services, which help keep upfront costs in check.
Operations with 500+ acres are often in the best spot to justify a full set of precision tools. Why? Fixed costs per acre get lower as you spread them across more land. In many cases, that can lead to ROI in 1 to 2 years.
How do I track ROI by field without extra work?
Use the equipment you already have to close the data loop. Yield monitors on pickers can record GPS-tagged harvest data in pounds per acre, then layer that information over your input maps so you can see where performance is falling short.
From there, export the data into your farm management software for year-over-year analysis. After harvest, go back through the logs and compare planned inputs with what actually happened in the field. That makes it easier to spot where costs drifted from your budget and where execution missed the plan.
Start with one field at a time. That keeps the process simple and gives you a clear way to test what’s working before you scale it across the farm.