If I want better cotton field decisions, I need more than one map. The short version is simple: I fly at the right crop stages, build NDVI and elevation layers, compare them with yield maps, then scout the weak zones first and treat those areas by cause.
Here’s the core idea in plain English:
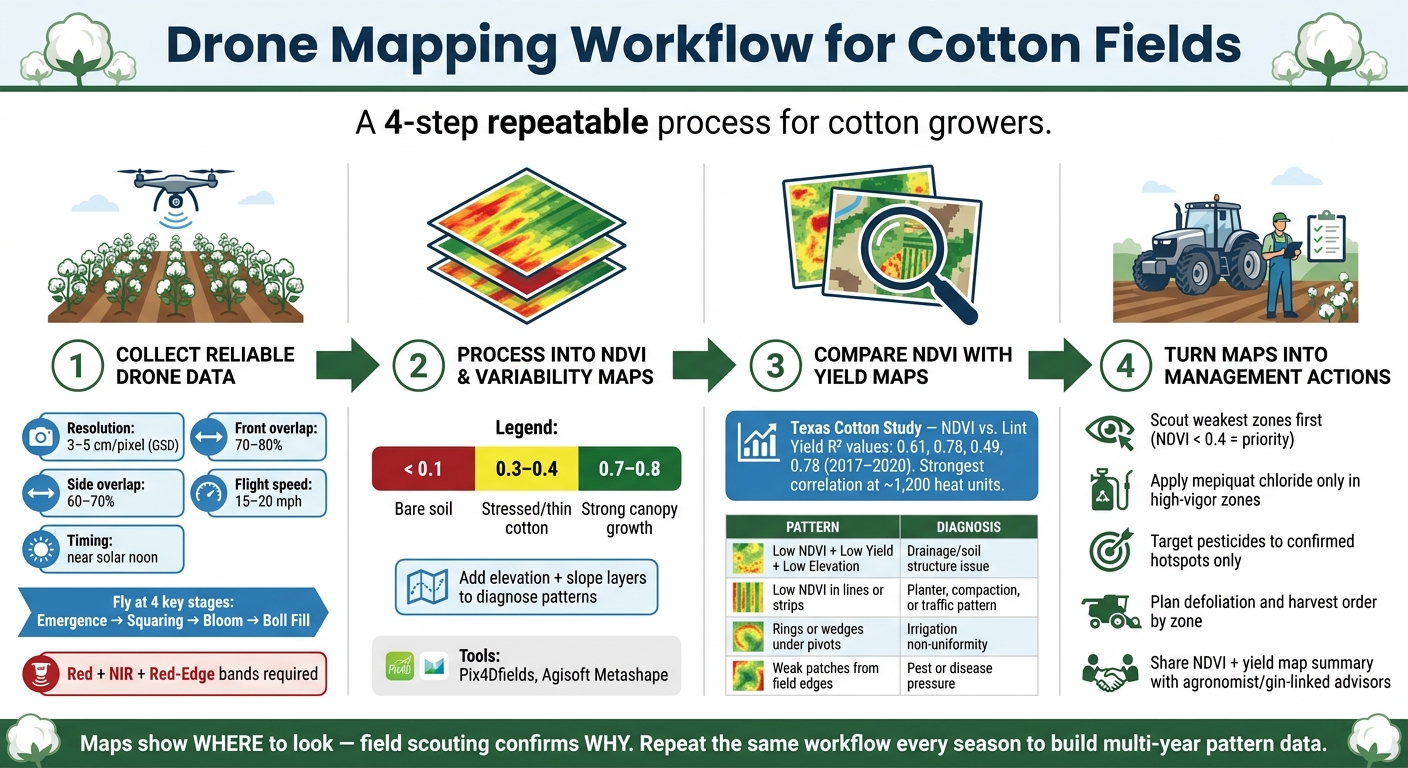
- NDVI shows crop vigor. In this article, values below 0.1 usually mean bare soil, 0.3–0.4 often points to thin or stressed cotton, and 0.7–0.8 usually shows strong canopy growth.
- Yield maps show where lint output dropped, often by 10%–20% or more in repeat problem areas.
- Elevation helps explain the pattern. Low spots often line up with drainage trouble. High spots can line up with dry stress or fertility limits.
- Timing matters. Flights at emergence, squaring, bloom, and boll fill give different answers, and early to mid-bloom often gives one of the best NDVI-to-yield checks.
- Data quality matters. I need 3–5 cm/pixel, 70%–80% front overlap, 60%–70% side overlap, and flights near solar noon for steady light.
- Maps do not replace field checks. They tell me where to look first, not the final cause.
- The end goal is action. I can use these zones to guide scouting, drainage work, irrigation review, input plans, PGR use, defoliation timing, and harvest order.
A few patterns matter most:
- Low NDVI + low yield + low elevation = drainage or soil structure issue is often the first thing I check
- Low NDVI in lines or strips = planter, compaction, or traffic pattern issue
- Rings or wedges under pivots = irrigation uniformity issue
- Weak patches spreading from edges = pest or disease pressure
One number from the article stands out: a Texas cotton study found NDVI and lint yield had R² values of 0.61, 0.78, 0.49, and 0.78 across different years, with one of the strongest links at about 1,200 heat units. That’s a good reminder that well-timed flights beat random flights.
If I keep the workflow the same each season, the maps become much more useful. Not because one image tells me everything, but because repeated patterns across flights and years show where the field keeps giving up yield.
Drone Mapping Workflow for Cotton Fields: 4-Step NDVI & Yield Guide
NDVI Mapping to Autonomous Field Spraying Workflow Explained
sbb-itb-0e617ca
Step 1: Collect Reliable Drone Data in Cotton Fields
Start with calibrated, clean, well-stitched imagery. If your images have blur, seam gaps, or poor lighting, your NDVI maps get weaker fast. And when that happens, later overlays with yield maps and field history can drift out of line. Those early setup choices shape everything that comes after.
Choose a Multispectral Drone and Sensor Setup
Use a multispectral sensor that records red, NIR, and red-edge bands. Red and NIR are the main bands used to calculate NDVI, while red-edge helps pick up early stress around squaring and early bloom. These bands form the map layers you'll later compare against yield data and drainage patterns.
The DJI Phantom 4 Multispectral combines RGB with five multispectral bands, a sunlight sensor, and factory calibration. A DJI Matrice paired with a MicaSense RedEdge gives you more payload options and tighter radiometric control on larger farms. Good band quality and solid georeferencing make NDVI-to-yield comparisons far more dependable.
Use RTK or differential GNSS. That can tighten positional accuracy to within a few centimeters, which matters when you're overlaying NDVI maps with yield data or equipment guidance lines. If RTK isn't available, place 3–5 ground control points on the field edge and 1–2 in the center to improve georeferencing.
Plan Flights Around Cotton Growth Stages
Fly at emergence, squaring, bloom, and boll fill. Each timing gives you a different read on the field.
- Emergence flights help spot stand gaps and uneven emergence while replanting or targeted scouting is still on the table.
- Squaring imagery can show canopy differences linked to nutrient, moisture, or compaction issues and help you sort scouting or variable-rate input plans.
- Bloom imagery can show water stress gradients and uneven growth across zones.
- Boll fill flights help confirm which areas have stayed lower in vigor and canopy density through the season, which supports defoliation timing and harvest planning.
For flight settings, aim for 3–5 cm per pixel (GSD). That gives enough detail to see row structure and small wet spots without leaving you with a massive image set. Use 70–80% front overlap and 60–70% side overlap for clean stitching and steady NDVI output. Fly about 15–20 mph and schedule missions near solar noon so shadows stay short and light stays steady.
Avoid Common Data Collection Mistakes
A few repeat mistakes cause most weak NDVI maps.
Insufficient overlap is a big one. Too little front or side overlap creates stitching gaps and shaky index values along seams. Check overlap settings in your mission planning software before takeoff.
Inconsistent altitude is another common problem, especially in rolling ground. If altitude changes across the flight, GSD changes too, and NDVI values get harder to compare across the map. Use terrain-following mode when it's available.
Passing clouds or low-angle light can also shift reflectance values even when crop health hasn't changed. That's why the calibration panel step matters. Capture images of your reflectance panel before and after each flight so your processing software can normalize values to true reflectance.
Field layout matters too. Around center pivots, use polygon flight boundaries that match the irrigated area instead of a basic rectangle. That helps you cover wet corners and low spots that often drive variability. Near power lines and roads, keep safe buffers and extra altitude margin, and set takeoff and landing zones away from farm traffic and public roads.
Once the imagery is calibrated and georeferenced, process it into orthomosaics, NDVI layers, and variability zones.
Step 2: Process Imagery Into NDVI and Field Variability Maps
Process Orthomosaics and Calculate NDVI
Once your images are clean and calibrated, the next job is to turn them into something you can actually use in the field: orthomosaics and index layers.
In Pix4Dfields, start a project, import the multispectral TIFFs, check that the field boundary is right, and run Fast processing to create the orthomosaic and surface model. When processing is done, trim the orthomosaic to the field boundary. Then open the Index Calculator and add NDVI using the NIR and red bands.
Agisoft Metashape works in much the same way. You move through photo alignment, dense cloud generation, orthomosaic creation, and then index calculation.
One thing matters a lot here: keep your setup the same for every pass. Use the same flight time, calibration routine, and radiometric settings each time.
Build Management Zones From NDVI Patterns
After that, mask bare soil and use a color ramp with thresholds to split the field into high-vigor, moderate-vigor, and weak-growth areas.
The main goal is not to chase exact cutoff numbers. It’s to spot patterns that keep showing up. If one zone stays low across more than one flight, that’s much more likely to be a real field issue than a one-off lighting or calibration problem. The same idea applies across seasons. Repeated patterns matter more than a single map.
Those zones then become the base layer for later yield-map comparison.
Add Elevation and Other Layers to Diagnose Problems
Once you’ve drawn the zones, bring in elevation and slope layers to help explain what you’re seeing.
A few common patterns tend to stand out:
- Low-lying weak zones often point to drainage problems.
- Higher spots with low NDVI often suggest moisture stress or fertility limits.
- If canopy temperature is available, add it too. Cool, low-NDVI canopies can point to disease pressure or canopy gaps.
Step 3: Compare NDVI With Yield Maps to Find Problem Areas
Overlay NDVI, Yield Maps, and Field History
This is the point where the work from Step 2 starts to pay off.
Bring your NDVI orthomosaic and cotton picker yield monitor data into the same GIS or farm management platform. Make sure both are clipped to the same field boundary and lined up in the same coordinate system. Then layer in planting maps, irrigation zones, and field-history notes.
Why does that matter? Because the extra layers help explain why a zone looks weak. You're not just staring at low numbers anymore. You're starting to connect those numbers to likely causes.
In one Texas cotton study, NDVI showed positive linear relationships with lint yield, with R² values of 0.61, 0.78, 0.49, and 0.78 at about 1,200 heat units. That’s why imagery from early to mid-bloom is often the sweet spot for this kind of comparison.
What Weak Zones Usually Indicate
A low NDVI zone can mean a lot of different things. One weak patch might point to drainage trouble. Another might trace back to planter skips. A third could be tied to irrigation issues.
The pattern matters. So do the location and field history.
Use the table below as a scouting guide to narrow your field visit:
| Weak Zone Pattern | Likely Cause | Key Clue to Check in the Field |
|---|---|---|
| Irregular patches, early season | Stand gaps or planter skips | Match against planting map; check plant population |
| Low-lying depressions or swales | Drainage problems, drowned-out stand | Align with elevation layer; look for shallow roots, bare spots |
| Linear bands near field edges | Compaction from turn rows or traffic | Check root depth and traffic patterns |
| Expanding patches from field margins | Insect pressure or disease spread | Scout for pest presence, lesions, or discoloration |
| Low vigor in one soil type | Nutrient stress (N or K deficiency) | Cross-reference soil test maps and fertilizer records |
| Rings or wedges under pivots | Irrigation non-uniformity | Check nozzle output and pressure records by zone |
The table helps point you in the right direction, but it doesn't give you a final answer. Imagery should trigger a field visit, not take its place. Several of these issues can leave behind almost the same NDVI pattern, so ground-truthing is the only way to tell what’s actually happening.
A Side-by-Side Field Example
Here’s what this can look like in practice.
A narrow strip of low NDVI shows up across the middle of a cotton field during early to mid-bloom. When the grower compares that strip with harvest data from the onboard cotton picker yield monitor, the same area shows 10–20% lower lint yield across multiple years of harvest data. Elevation data then add another clue: the strip sits along a slight depression where water tends to collect after heavy summer storms.
A field check fills in the rest of the story. The grower finds an uneven stand, smaller plants, and signs of past waterlogging, including shallow root systems and scattered bare patches where seedlings likely drowned out earlier in the season. Soil tests show nutrient levels are adequate, but soil structure is poor and compaction is higher in the depressed area.
That kind of match between imagery, yield, and field checks is what should guide the next scouting pass and the zone-by-zone decisions in Step 4.
Step 4: Turn Maps Into Cotton Management Actions
Once the maps show where problems keep showing up, it’s time to turn that into zone-by-zone action.
Send Scouts to the Weakest Zones First
When the overlay shows a weak zone that keeps coming back, scout that area first. Pay close attention to spots with NDVI values below 0.4, since those often point to thin or stressed vegetation.
When scouts get there, the job is simple: confirm the cause. Use the map as a guide to narrow down what you’re looking for, whether that’s insects, disease, waterlogging, drought stress, stand gaps, or nutrient stress. Multispectral imagery can also point to pest stress before it’s easy to spot on the ground.
For each zone, record the cause, exact location, and photo proof. That field record matters more than it may seem at first. When you fly the same field again in 60 days or check it next season, those ground-truth notes show whether the trouble spot got better, stayed the same, or slipped further.
Then use those scouting notes to decide what treatment that zone needs next.
Adjust Inputs, Irrigation, and Harvest Plans by Zone
Once you’ve confirmed the cause, move from diagnosis to action. Use NDVI zones to apply mepiquat chloride only where canopy growth is too strong. If scouts confirm pest hotspots, use those same zone lines to target miticide or insecticide only where it’s called for.
On the water side, NDVI and elevation layers can point out areas that need closer review for irrigation timing or drainage work. Those same zone boundaries can also help you plan defoliation and picking by segment instead of treating the whole field like it behaves the same way.
Pull those decisions together before sharing them with advisors.
Share Map Summaries With Gin-Linked Advisors and Local Partners
A drone map buried on your laptop won’t help your agronomist or crop consultant make a call. Put together a simple package with:
- your NDVI orthomosaic clipped to field boundaries
- the yield map overlay
- the management zone boundaries you drew
- the scouting notes tied to each zone
That gives an advisor what they need to weigh input rates, timing, drainage fixes, or harvest priority without having to piece the whole story together from scratch.
Gin-linked advisors can use that same summary to talk through harvest timing and fiber quality protection across variable zones. Send it before the meeting so everyone starts with the same map.
Conclusion: Build a Repeatable Drone Mapping Workflow for Cotton
After you scout weak zones and take action, run the same workflow again next season. Think of it as a repeatable system, not a one-off flight. Use the same multispectral process each year: fly at key growth stages, process NDVI the same way each time, compare those maps with yield maps, and make decisions by zone.
A Texas A&M study found NDVI-yield relationships with R² values of 0.61, 0.78, 0.49, and 0.78 across 2017–2020, with the strongest relationship at about 1,200 heat units. That’s why timing matters more than convenience. A well-timed flight can tell you far more than an easy one.
Archived UAV and satellite NDVI maps can also help with later-season irrigation decisions, as long as flight records, yield maps, and prescriptions stay organized.
NDVI works best when you pair it with elevation, thermal, and yield data.
Share one standardized map summary so everyone is working from the same field data. Then repeat the cycle. Each season, your team starts with better information and a clearer path for field decisions than the season before.
FAQs
How often should I fly cotton fields in one season?
Start with a baseline flight soon after emergence to map stand establishment.
Then fly every two weeks during squaring and boll development. Some growers also do weekly scouting from V6 to check vigor and help target applications.
Add a late-season flight to assess defoliation readiness. For the best data, fly on clear, calm days close to solar noon.
When does NDVI stop being useful in cotton?
NDVI tends to lose usefulness once cotton hits peak canopy density in the mid- to late season. At that point, the signal can saturate and flatten out, so it becomes less sensitive to added changes in biomass or plant health.
When that happens, NDRE is often a better fit because it uses the red edge band to separate chlorophyll levels and disease severity more clearly in dense, mature foliage.
What should I check first if low NDVI keeps repeating?
First, compare current drone imagery with historical yield maps and soil data. When you layer that information in a GIS, it becomes much easier to see whether the same weak zones show up year after year.
If low NDVI keeps appearing in the same spots, that usually points to a persistent problem, such as soil compaction, nematode pressure, or poor drainage. From there, ground-truth those areas with targeted scouting or soil testing before you put any inputs to work.