If I wait until cotton shows stress, I’m already late. The main point of weather monitoring is simple: use field data early enough to change what I do - with irrigation, spraying, storm prep, defoliation, and harvest.
Here’s the short version:
-
Cotton loss changes by season.
- Early season: cool, wet weather can hurt emergence and stand uniformity.
- Bloom and boll fill: heat above 95°F, warm nights above 77°F, and dry soil can cut boll retention and fiber quality.
- Late season: 2+ inches of rain on open bolls and early frost can hurt yield and grade.
-
The core tools are straightforward.
- On-farm weather stations track field-level temperature, humidity, rain, wind, solar radiation, and soil temperature.
- Soil moisture sensors help me decide when to start and stop irrigation.
- Radar, satellite imagery, and phone alerts help me react to storms, spray windows, and stress zones faster.
-
Setup matters as much as the hardware.
- Bad sensor placement leads to bad calls.
- I need stations in open areas and soil probes at multiple depths like 6, 12, 24, and 36 inches.
- Alerts should match the job, like wind above 10–12 mph for spraying or frost warnings around 36–38°F.
-
The payoff comes from better timing.
- Irrigate before heat and drought hit peak stress.
- Avoid spray drift and inversion risk.
- Defoliate in the right temperature window.
- Harvest before rain, high wind, or frost lowers grade.
-
The numbers can work.
- One Texas sensor-based irrigation case showed $25.29 per acre in pumping savings in year one.
- Another result showed 1.91 acre-inches per acre per year in water savings.
- Satellite services may run about $0.50 to $5.00 per acre per year, while advanced stations can cost $3,000 to $4,000+.
Webinar: Managing heat stress in cotton
sbb-itb-0e617ca
Quick comparison
| Tool | What I use it for | Best fit |
|---|---|---|
| Weather station | Track local wind, rain, heat, humidity, frost risk | Farms that need field-level spray and storm calls |
| Soil moisture sensors | Time irrigation and watch root-zone water | Irrigated cotton, especially where pumping cost is high |
| Satellite imagery | Find weak zones and scout faster | Large acreage or scattered fields |
| Radar forecast | Watch incoming rain, wind, and storms | Any cotton farm |
| Mobile alerts | Send warnings to the right crew fast | Farms with multiple people making field decisions |
Bottom line: I don’t need more weather data just to look at a dashboard. I need data that tells me when to irrigate, when to spray, when to stop, and which fields to move on first. That’s what protects yield and fiber quality.
Step 1: Choose the Right Weather Monitoring Tools for Cotton
Not every cotton farm needs the same setup. A dryland field and a pivot-irrigated operation can need very different tools. The simplest way to choose? Match your tools to the calls you make most often: irrigation, spraying, and storm prep.
Start with the data that guides irrigation. Then layer in alerts that help protect spray and harvest windows.
On-Farm Weather Stations for Field-Level Data
Airport and city weather stations can miss what’s happening in the field. A small rain event, a sharp temperature swing, or a wind shift can show up on your farm and nowhere else nearby. That’s why extension programs like Georgia’s automated weather station network advise cotton growers to either install on-farm stations or use nearby agricultural mesonet stations that line up with field conditions.
For cotton, six sensors do most of the work:
- Air temperature
- Relative humidity
- Rainfall
- Wind speed and direction
- Solar radiation
- Soil temperature
Air-temperature readings should be accurate to about ±1°F and collected hourly or more often. That helps you track heat stress and frost risk. Wind sensors should deliver ±1 to 2 mph accuracy and directional resolution of 1 to 5 degrees, which matters for spray drift control. Solar radiation data helps estimate evapotranspiration (ET) and crop water use.
Accuracy is only part of the story. In cotton country, sensors deal with dust, heat, and hard storms. So it pays to look for corrosion-resistant housings, regular calibration support, and systems with cellular telemetry plus mobile dashboards that refresh every 5 to 15 minutes. Placement matters too. Keep stations at least 50 to 100 feet from buildings or tree lines, mount temperature and humidity sensors at about 6.5 feet, and place wind sensors between 6.5 and 33 feet above the ground.
Soil Moisture Sensors for Irrigation Decisions
Soil moisture sensors come in two main types: ones that measure soil water tension and ones that measure volumetric water content. Each one fits a different irrigation setup and management style.
Tensiometers and resistance-based sensors measure tension in centibars. They fit furrow and pivot irrigation well. Cotton Inc. guidance puts common irrigation trigger points around 50 to 60 centibars, with sandier soils often triggering closer to 30 centibars and heavier clays closer to 50 centibars.
Capacitance and TDR-style probes measure volumetric water content. They pair well with automated pivot and drip systems because they support continuous telemetry and can trigger pump schedules automatically. For dryland cotton, portable TDR devices are a good way to spot-check moisture across several fields.
Placement is a big deal here. Put sensors at multiple depths, roughly 6, 12, and 24 inches, so you can see how water moves through the root zone during squaring and boll fill. The shallow sensor shows fast drying. The middle depth reflects the main extraction zone. The deepest sensor shows whether water is reaching the bottom of the root profile.
That kind of detail can pay off. A Texas study on sensor-based irrigation scheduling found reduced pumping costs of $25.29 per acre in year one and water savings of 1.91 acre-inches per acre per year, adding up to $32,276 in savings over 10 years on a 125-acre farm.
Satellite, Radar, and Mobile Alerts for Fast Decisions
Below-ground sensors tell you what the crop needs. Above-ground alerts tell you when to move.
Radar forecasts help show when rain, wind, or storms will reach the field. That can help protect spray and harvest windows. Satellite imagery that tracks NDVI (Normalized Difference Vegetation Index) maps canopy vigor across the farm and can flag weak areas before stress shows up to the eye.
Low-NDVI zones can point to sandier soils that dry out faster, blocked pivot nozzles, or clogged drip lines. In plain English: they help you scout the right acres first instead of guessing.
Mobile alert platforms pull weather station data and soil sensor readings into one stream, then turn that data into text or app notifications. That might mean wind above 15 mph, soil moisture dropping below your set point, or temperatures getting close to your frost threshold. Automated alerts help turn raw numbers into same-day field calls.
Step 2: Install and Set Up Systems So the Data Works for You
Bad placement leads to bad data. Step 2 is where the tools from Step 1 start earning their keep. You place them well, set cotton-specific alerts, and send readings to the people who make the call in the field. Once the numbers are solid, you can use them to guide irrigation, spraying, and harvest timing.
Place Weather Stations and Sensors in the Right Spots
Put your weather station in an open, level area that reflects the conditions in your cotton field. Mount temperature and humidity sensors 4–6 ft above the ground, keep them at least 100 ft from large paved surfaces, and place wind sensors in open exposure at about 10 times the height of the nearest obstruction from buildings or trees. For spray and defoliation work, mount the wind sensor 6–10 ft above the vegetation so the reading matches field conditions more closely. Rain gauges should be level, mounted 4–6 ft above ground, and kept away from objects that can block rain or stir up airflow around the gauge opening.
Soil moisture sensors need the same level of care. Install them at 6, 12, 24, and 36 inches deep so you can watch water move through the active root zone. In sandy soils, lean toward shallower depths - about 4–6, 10–12, and 18 inches - since water moves down fast and roots rely more on the upper profile. Place sensors 2–3 inches from healthy plants on the wetted side of the row. Stay out of wheel tracks, end rows, and low spots that don't reflect the rest of the field.
That setup matters more than it may seem. Every alert and threshold you set later depends on these readings.
Set Alert Thresholds That Match Cotton Operations
Set alerts around the jobs your crew deals with most: irrigation, spraying, frost response, and harvest.
| Operation | Alert Type | Recommended Threshold |
|---|---|---|
| Herbicide / insecticide spraying | Wind speed | Notify above 10–12 mph sustained at boom height |
| Spray-drift inversion risk | Wind speed | Notify below 3 mph near sunrise/sunset |
| Defoliation | Wind speed | Same 3–10 mph window; alert at 10 mph |
| Harvest operations | Wind gusts | Alert at 20–25 mph for module tarp and lint loss risk |
| Frost risk (late-season bolls) | Temperature | Alert at 36–38°F forecast minimum for early action |
| Hard freeze (boll damage) | Temperature | Alert at 28–30°F for immediate harvest prioritization |
| Heavy rain / equipment access | Rainfall | Alert at 1 inch/day or 1 inch within 1 hour |
| Irrigation start | Soil moisture | About 40–50% plant-available water depleted during peak demand |
| Irrigation shutoff | Soil moisture | Soil profile refilled to field capacity |
Soil moisture triggers should shift with crop stage. During early vegetative growth, let depletion reach 50–60% before irrigating. From first bloom through early boll fill, tighten that to 30–40% depletion to help prevent fruit shed. Before you lock in final trigger points, run the sensors through at least one full wetting-and-drying cycle and watch where plant stress starts to show. That's often where the numbers stop being abstract and start making sense.
Connect Field Data to Phones and Daily Workflows
Pick stations and sensors with cellular or Wi‑Fi connectivity so data flows to a cloud portal on its own. Then set up role-based views for the people using it day to day.
- A manager's dashboard can show all fields, soil profiles, and forecast updates
- An irrigator's screen can focus on soil moisture triggers and irrigation status
- A spray operator's view can show live wind speed, humidity, and spray-drift inversion risk
Each alert should go straight to the irrigators, spray crews, and harvest managers who need to act on it. No bottlenecks. No guessing who saw the message.
At each crop stage change, review which thresholds are turned on, who gets each alert, and whether the last set of notifications led to action. Once the sensors are in place and alerts are routed well, the data becomes something your team can use to time irrigation, spraying, defoliation, and harvest.
Step 3: Turn Weather Data into Better Cotton Management Decisions
Use those readings to make faster calls in the field all season long. Start with irrigation. Then use the same data to plan spray windows, harvest timing, and storm prep.
Time Irrigation Around Heat and Drought Stress
Track ET, rainfall, and soil moisture in a daily water balance. When the deficit gets close to 2 inches on silt loam or 3 inches on clay, irrigate. On sandier soils, lean on tension readings and move sooner.
It also pays to get ahead of a rough stretch. If several hot, dry, windy days are coming, irrigate before they arrive, even if your sensors haven't hit the usual trigger yet.
Field trials back that up from another angle too. Sensor-triggered irrigation at a 90 kPa threshold produced 16% higher lint yield than non-irrigated plots or plots triggered at 50 kPa.
If water or pumping capacity is tight, focus first on:
- lighter-textured fields
- fields at peak bloom
- fields in early boll fill
A dashboard that ranks ET deficit and sensor trend can make those choices much easier. Then, at about 10% open bolls, start easing irrigation and shut it off soon after.
Pick Safer Windows for Spraying, Defoliation, and Harvest
Once water is in hand, use the same forecast stream to pick safer windows for applications and harvest.
For herbicide and insecticide work, look for wind that stays steady between 3 and 7 mph and blows away from the crop. Speeds above 10–15 mph can push product off target. On the flip side, dead-calm conditions can point to inversions, which may carry fine droplets where you don't want them. If wind or inversion risk looks bad, push sensitive applications to late morning or another day.
Defoliants tend to work best when daytime highs are in the 65–85 °F range, with enough sunlight and no rain in the next 6–12 hours. Check the forecast before you lock in a defoliation date. If a cool, wet front is on the way, either defoliate while it is still warm or wait until the front moves through. Bad timing can leave more leaf trash and lead to gin discounts that are tough to get back from.
For harvest, radar helps you spot clean windows before storms roll in. Start with fields that have the most open cotton and the soils most likely to stay muddy after rain. That matters for more than keeping equipment moving. It helps protect grade and fiber quality. Harvesting wet cotton can lead to stringing, staining, and bark trash, which can cost several cents per pound in grade discounts.
Get Ready for High Wind, Heavy Rain, and Frost Events
Set wind alerts at 25–35 mph sustained so you have a clear trigger for action. That can mean securing module covers, moving equipment into sheltered spots, and picking faster on exposed fields.
If a major front or tropical system is in the forecast, watch for falling barometric pressure and shifting wind direction. Those are signs that conditions are getting worse. In that situation, extra hours before the event can help you finish the most exposed fields before the weather turns.
For heavy rain, harvest higher-elevation, well-drained fields first. Make sure module wraps are sealed before rain arrives. After the rain, use soil moisture readings to time re-entry and avoid compaction.
Late in the season, the same setup can help you finish harvest before cold weather slows everything down. When lows drop to 34–36 °F, you usually have 48–72 hours to move labor and equipment. Put the fields with the highest share of open bolls at the top of the list.
Station-level temperature readings can also show cold pockets within a farm that a regional forecast may miss. That gives you a sharper read on frost risk when timing is tight.
Step 4: Weigh Costs, Measure Payback, and Plan Logistics
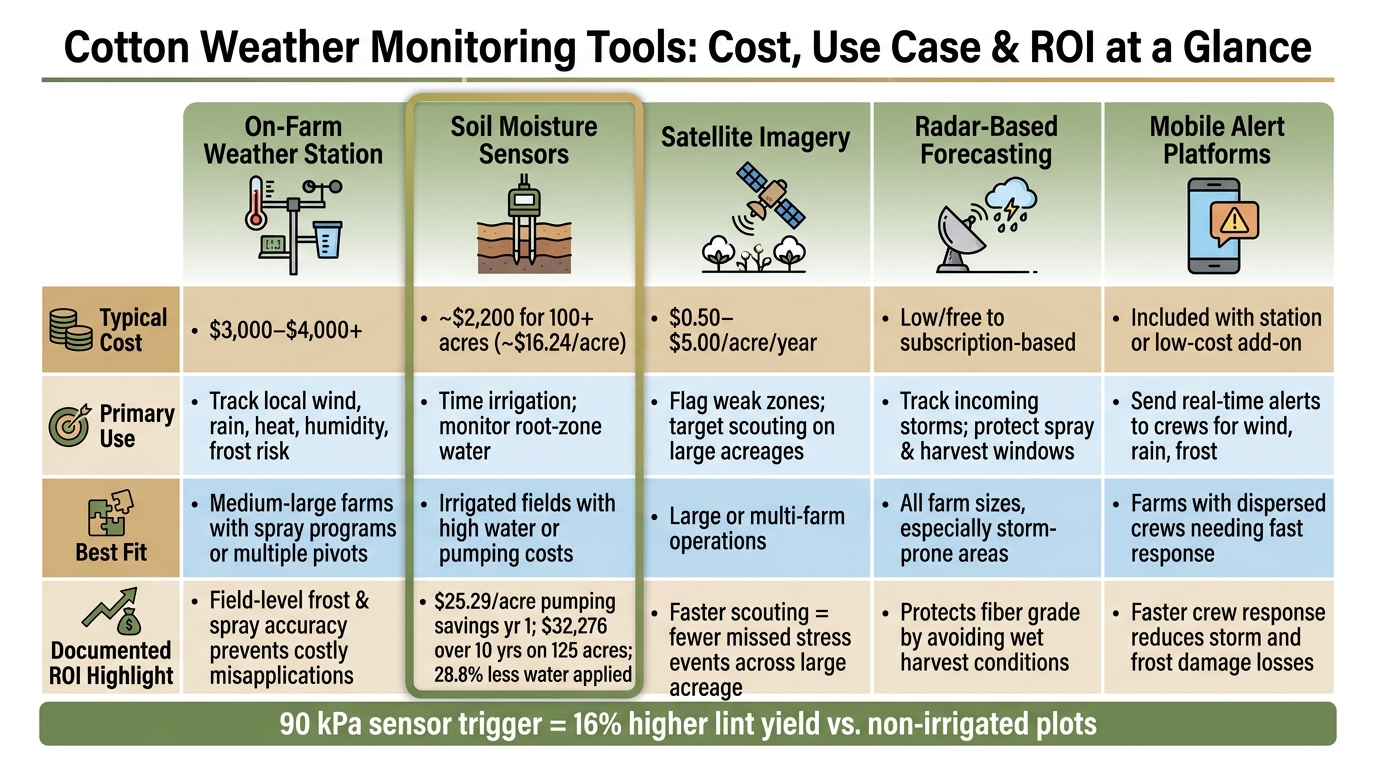
Cotton Weather Monitoring Tools: Cost, Use Case & ROI Comparison
Once weather data starts improving field calls, the next question is pretty simple: what does it cost per acre, and does it pay for itself? If the system is already helping with irrigation, spray timing, and harvest calls, that’s the test that matters.
What Growers Pay For and Where the Return Comes From
Weather monitoring costs usually land in four buckets: hardware, installation/setup, data subscriptions, and maintenance/replacement.
Basic weather stations cost a few hundred dollars. More advanced systems run about $3,000–$4,000+. Soil moisture sensor systems for a little over 100 acres have been listed at about $2,200 total. That includes a $450 base unit, three sensors at $525 each, and a $175 seasonal data plan. On a per-acre basis, that comes to about $16.24 per acre. Satellite imagery subscriptions usually cost about $0.50–$5.00 per acre per year.
The return shows up in a few very practical places: water savings, fewer re-sprays, better defoliation timing, and less harvest loss. In one cotton case, an IoT-based sensor system cut water applied by 28.8%, reduced pumping hours by 16.2%–16.5%, and increased crop water productivity by 52.5%.
That kind of math adds up fast. Skip a few irrigation sets. Avoid a couple of re-sprays. Get ahead of spray delays, storm damage, or harvest downtime. Suddenly the system isn’t just another expense line.
A simple way to estimate payback is to divide total annual cost by expected annual savings, then convert that result to a per-acre figure.
Tool Comparison Table: Matching Weather Monitoring to Cotton Needs
| Tool | Where It Pays Off | Best Fit |
|---|---|---|
| On-farm weather stations | Protects spray programs and frost response with field-level accuracy | Medium to large operations with multiple pivots or sensitive spray programs |
| Soil moisture sensors | Cuts water and pumping costs; documented payback in cotton case studies | Irrigated fields where water cost or drought risk is high |
| Satellite imagery | Flags weak zones early so scouting targets the right acres first | Large acreages and multi-farm operations |
| Radar-based forecasting | Keeps harvest and spray windows open by tracking incoming storms | All sizes, especially where storms frequently disrupt harvest |
| Mobile alert platforms | Speeds crew response to wind, rain, and frost before damage occurs | Farms with dispersed crews needing rapid weather response |
Use cottongins.org to Support Harvest and Hauling Decisions
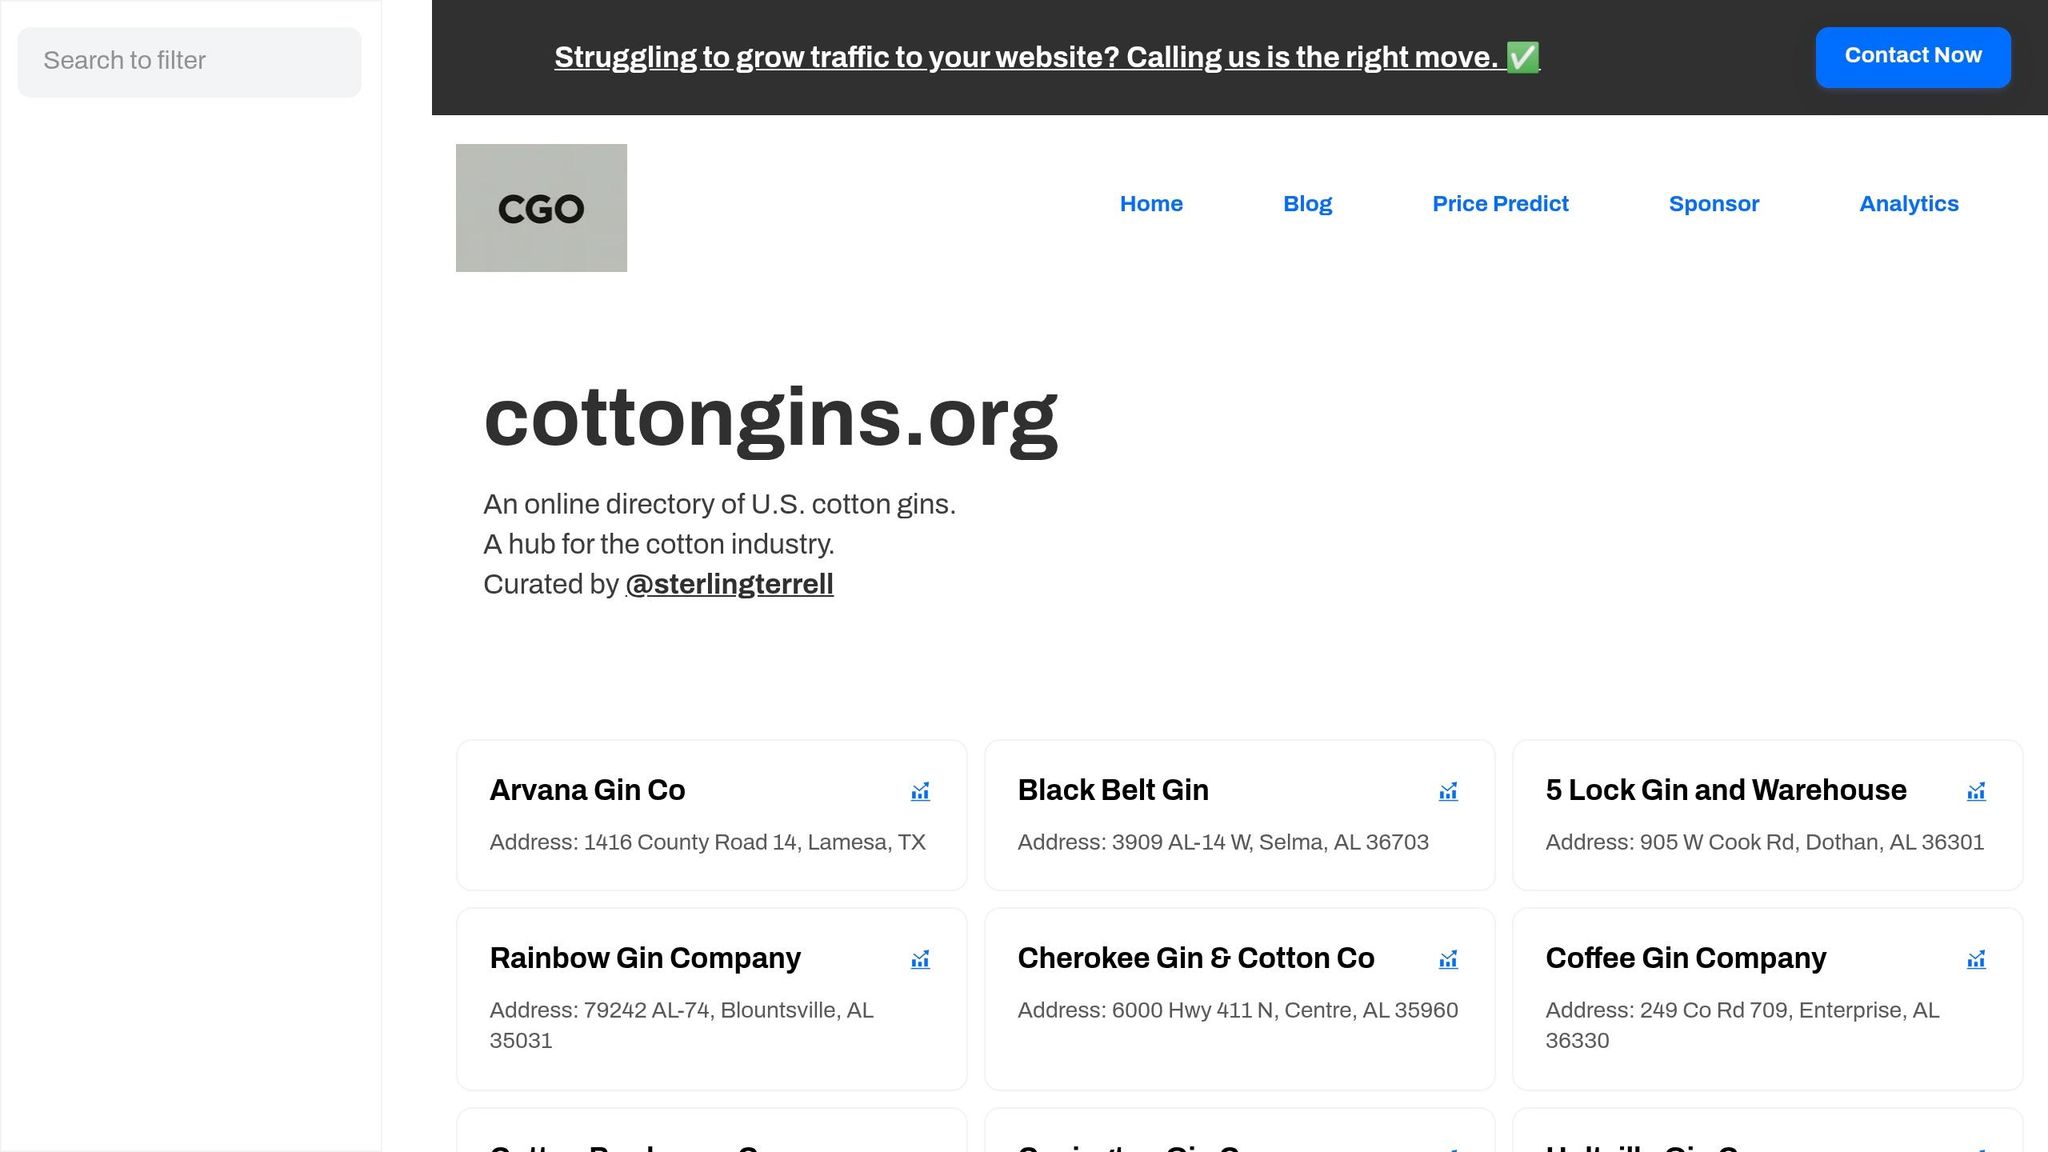
Weather alerts help protect the crop. Gin logistics help protect the schedule.
When rain, wind, or frost squeezes the harvest window, it helps to know where nearby gins are before the pressure hits. That can make it easier to move modules faster and cut weather damage while cotton is still sitting in the field. cottongins.org is a directory of U.S. cotton gins listed by county and state. Use it to map nearby gins before storms compress the harvest window.
Conclusion: Build a Weather Monitoring Plan That Protects Yield and Fiber Quality
Cotton faces heat, drought, wind, heavy rain, and frost through almost every part of the season. Any one of them can cut yield, slow fieldwork, or hurt fiber quality before you can react. The growers who keep losses in check usually have one thing in place: field-level weather data early enough to do something with it.
That’s the next move. Build a system around the choices you make day to day. Keep it simple and tied to how your operation runs. Start with the weather risks that hit hardest where you farm. Then add the tools that help you respond:
- On-farm weather stations for local conditions
- Soil moisture sensors at more than one depth to guide irrigation
- Satellite imagery to spot stress across large acreages
- Radar-based forecasting to protect spray and harvest windows
- Mobile alerts so crews can move before storms arrive
From there, tune sensor triggers to crop stage, soil type, and irrigation system.
Placement matters just as much as the hardware. So do alert thresholds. A station set in the wrong spot, or an alert that’s too loose, can fail right when frost rolls in or wind starts building before a spray run. Set thresholds around your operation: heat stress cutoffs, rainfall accumulation limits, and wind speed triggers. Then send those alerts straight to the phones of the people who need to act.
When all of that works together, you see the payoff across the season. It starts with irrigation and carries through harvest. The idea is simple: faster, better-informed decisions cut losses and protect returns. A weather monitoring plan does its job when it helps you act before damage starts.
FAQs
Which weather tool should I start with first?
For many cotton operations, soil moisture sensors are a smart first step. They give you real-time data from the root zone, so you can set irrigation triggers based on what the crop is actually feeling, not just on broad forecasts.
That can cut back on extra irrigation, lower energy use, and help keep soil nutrients in place. Smaller farms don’t need to go all in at once, either. They can begin with basic sensors and simple controllers, then add weather stations, satellite imagery, or automated irrigation systems as their needs and acreage grow.
How many soil moisture sensor depths do I need?
For cotton, use multi-level probes at 4-inch intervals down to 60 inches so you can track moisture across the full root zone.
For day-to-day management, pay attention to three key depth ranges:
- 0–12 inches for daily water use
- 12–36 inches for root development
- 36–60 inches for total water reserves
Some systems can also track water movement well down to 3 feet.
How do I set weather alerts for my fields?
Start with on-farm weather stations or mobile apps that give you predictive analytics and real-time monitoring. Then connect that data to a farm management platform where you can set custom thresholds for metrics like soil moisture, canopy temperature, and humidity.
As those numbers get close to your set limits, telemetry can send alerts straight to your phone or desktop. That gives you a chance to act fast on irrigation, spray timing, or storm prep before a small shift turns into a bigger problem.