If your cotton field changes from one end to the other, one flat input rate can waste money. I’d sum it up like this: variable rate technology works best when field zones are different enough to justify changing seed, nitrogen, PGRs, irrigation, or spray rates by area.
Here’s the short version:
- I use VRT to cut input waste on low-return acres and push output on stronger acres
- The best fit is usually fields with soil shifts, slope changes, uneven drainage, or yield swings
- Sensor-based systems may break even with 5% to 11% input savings
- Map-based systems often need about 11% savings to cover costs
- In one cotton study, variable-rate PGRs and ripeners added $61.62 per acre by making plant height and ripening more even
- A smart first step is one field, one input, one season, then compare against flat-rate strips after harvest
What matters most is simple: not every field needs VRT. If your field is uniform, the payoff may be weak. But if you see patchy yield history, texture changes, or uneven vigor, zone-based input rates can pencil out.
A few areas tend to offer the best shot at payback:
- Nitrogen, especially on erodible ground or zones with more organic matter
- Seeding, where water-holding capacity or EC varies
- PGRs and ripeners, where crop vigor changes across the field
- Crop protection, when pressure is patchy
- Irrigation, when soil moisture demand is uneven
To get started, I’d keep the setup small:
- GPS guidance
- field boundaries
- soil sampling
- a prescription map
- a rate controller
- equipment that can change rates in the field
The main idea is easy to follow: match inputs to the parts of the field that can pay for them. Then check the numbers after harvest and expand only where the return shows up.
Variable Rate Fertilizer
sbb-itb-0e617ca
How VRT Works in Cotton Fields
The payoff from VRT comes down to one thing: how closely the prescription fits the way the field actually changes from one area to the next. At its core, VRT turns field variability into zone-based rate decisions. The process is pretty simple on paper: collect data, build zones, load rates, apply them in the field, and check the results after harvest.
Data Sources That Drive Cotton Prescriptions
One data layer alone won’t cut it. Solid cotton prescriptions usually pull from yield maps, soil texture, organic matter, elevation, and real-time vegetation indices like NDVI.
These layers matter for a reason. Soil texture, water-holding capacity, organic matter, and soil depth help shape management zones because they affect how the crop responds across the field. SSURGO supplies soil texture, water-holding capacity, and organic matter data. The National Elevation Dataset adds topography.
For in-season changes, optical sensors such as the GreenSeeker and Yara N-Sensor measure canopy NDVI at early bloom and feed that information into rate decisions for nitrogen, PGRs, and fruit ripeners. A 29-site-year trial across Tennessee, Louisiana, Mississippi, and Missouri found that NDVI performs best when it’s paired with yield maps or soil productivity zones. That pairing led to better nitrogen prescriptions, especially on more erodible soils and in fields with higher organic matter.
From Field Maps to Prescription Maps
Once those layers are pulled together, they’re turned into management zones. The field gets split based on yield potential, soil type, or productivity history. Then each zone receives its own target rate for seed, fertilizer, or water.
That same zone logic can also guide growth management. PGR and ripener timing can be adjusted using NDVI, plant height, and open-boll counts.
Controllers and Applicators That Change Rates on the Go
Building the prescription is only half the job. The equipment still has to carry it out with accuracy. GPS-guided controllers and electronic flow controllers read the prescription map and change rates as the machine moves through each zone.
This is where small setup mistakes can cause big problems. Before each pass, check that the map loaded the right way and calibrate the controller. After harvest, picker yield data shows which zones delivered a return and which prescriptions need to be tuned for the next round.
Where VRT Pays Off in Cotton
Variable Rate Technology for Cotton: Input-by-Input ROI Breakdown
VRT tends to pay when field zones differ enough to cover the extra cost. After a grower builds prescriptions, the next step is simple: figure out where those prescriptions produce enough return to be worth using.
Variable Seeding and Fertility by Soil Zone
Cotton plant population can change by zone based on soil water capacity or electrical conductivity. Low-potential zones can support fewer plants, while high-potential zones can support more.
The best returns usually come from inputs that change the most across the field. Variable-rate nitrogen often pays best on erodible soils and in zones with higher organic matter, stronger water-holding capacity, or deeper soil profiles. In those settings, VRN can improve N efficiency and lower the chance that net returns drop below uniform farmer practice. On fields with little variability, though, nitrogen savings often don't cover the added cost.
Targeted PGR, Irrigation, and Crop Protection
Plant growth regulators are another place where VRT can make sense. If vigor shifts across a field, variable-rate PGR and fruit ripener applications can help even out plant height and boll opening. That matters because it can make mechanical harvesting easier. In a multi-year trial, variable-rate PGR and ripener management increased net income by $61.62 per acre ($152.28 per hectare), even though yield differences were not statistically significant.
Crop protection tends to pay when pressure is patchy enough for spot treatment. Sensor-based systems can hit profitability with 5% to 11% input savings, while map-based systems usually need about 11%.
Variable-rate irrigation works best when soil moisture, topography, or EC mapping shows uneven water demand across the field.
How Growers Measure ROI per Acre
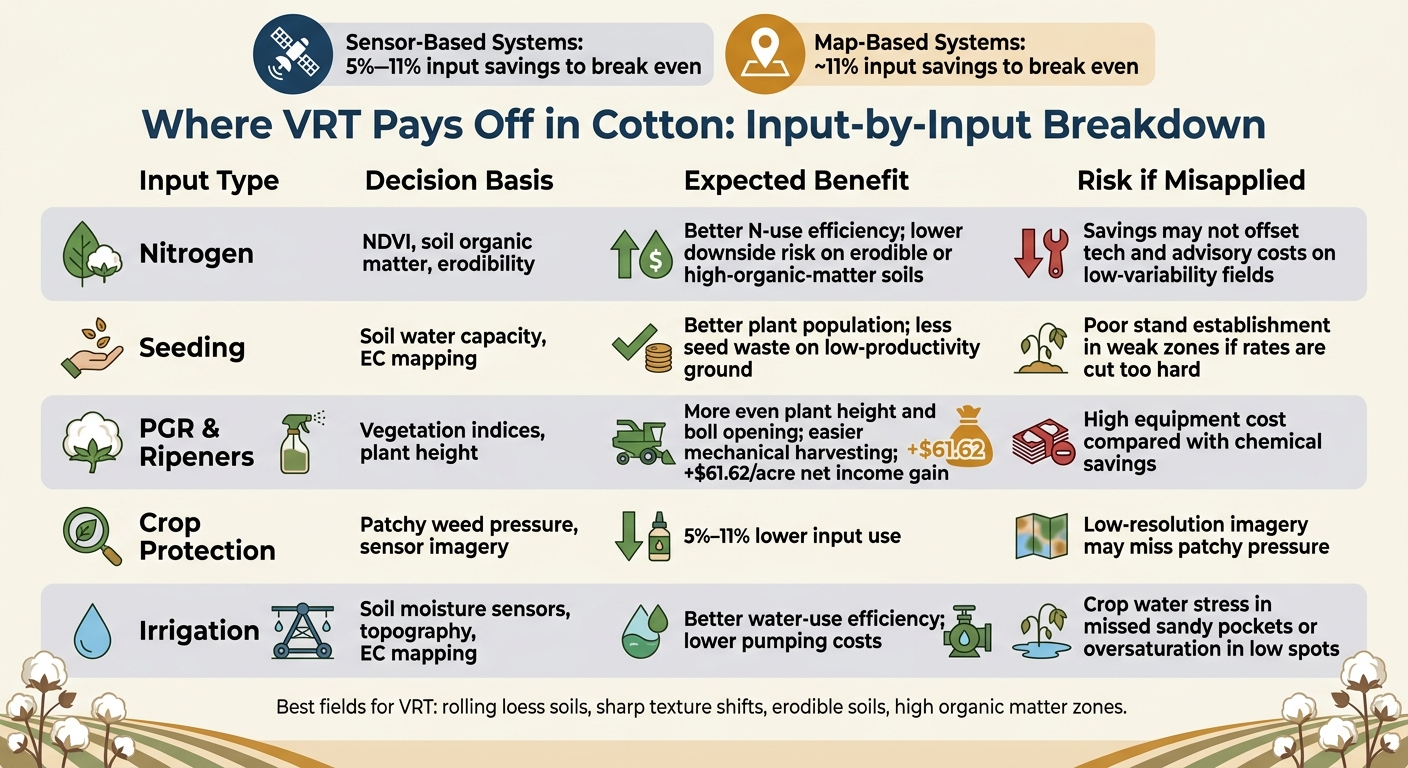
| Input Type | Decision Basis | Expected Benefit | Common Risk if Misapplied |
|---|---|---|---|
| Nitrogen | NDVI, soil organic matter, erodibility | Better N-use efficiency; lower downside risk on erodible or high-organic-matter soils | Savings may not offset tech and advisory costs on low-variability fields |
| Seeding | Soil water capacity, EC mapping | Better plant population; less seed waste on low-productivity ground | Poor stand establishment in weak zones if rates are cut too hard |
| PGR & Ripeners | Vegetation indices, plant height | More even plant height; boll opening; easier mechanical harvesting | High equipment cost compared with chemical savings |
| Crop Protection | Patchy weed pressure, sensor imagery | 5% to 11% lower input use | Low-resolution imagery may miss patchy pressure |
| Irrigation | Soil moisture sensors, topography, EC mapping | Better water-use efficiency; lower pumping costs | Crop water stress in missed sandy pockets or oversaturation in low spots |
Tools and Setup Needed to Start
Once an input shows clear return potential, build only the setup needed to apply it with precision. Start with GPS guidance, field boundaries, and grid or zone soil sampling. That gives you a clean starting point and makes the next move simple: buy only the tools needed for your first variable-rate pass.
Core Tools for a Basic VRT Program
| Tool | Function | Best Use Case |
|---|---|---|
| GPS Guidance | Provides precise spatial positioning | Essential foundation for all VRT passes |
| Soil Sampling (Grids/Zones) | Maps nutrient levels and soil properties | Variable rate fertility and seeding |
| Prescription Map | Turns field data into application instructions | Bridging agronomic data and field application |
| Rate Controller | Changes output on the go | Adjusting fertilizer, PGR, or seed rates |
| Compatible Applicator | Applies variable rates in the field | Sprayers or spreaders that can vary rates |
Start with one input only - usually nitrogen or seeding - before you branch out. That keeps costs in check and makes it easier to see what’s working.
Optional Data Layers and Advanced Upgrades
Once the first prescription is up and running, extra data layers can tighten zone boundaries and help with in-season calls. That’s when many growers add yield monitors, optical sensors, imagery, and telemetry.
Yield monitors can help fine-tune future management zones. Optical sensors such as GreenSeeker™ or Yara™ N-Sensor can support in-season nitrogen decisions. Remote sensing imagery and telemetry add more visibility during the season, which can help when conditions shift fast.
Using Industry Connections to Support VRT Adoption
Custom hiring can handle data collection, prescription building, and application. That gives growers a way to test VRT without buying a full tech stack right away. Local agribusiness support can also help with service, calibration, and agronomic coordination, which keeps the first rollout practical and calibrated.
Implementation Steps and When VRT Makes Financial Sense
A First-Year Rollout Plan
Once the basic tools are set up, keep the first year simple: one field, one input.
Start with a field that shows clear spatial variability in yield maps, elevation, or satellite vegetation data. If a field looks uniform, skip VRT for now. That kind of restraint matters. VRT works best when the field is telling you there are meaningful differences from one area to another.
From there, build your first prescription using those data and focus on a single input, most often nitrogen. If you're applying nitrogen in season, early-bloom NDVI from optical sensors can help fine-tune the prescription.
After harvest, compare the VRT area with uniform-rate strips to see if the prescription improved returns. Keep notes by field and by zone so the comparison stays clean and useful. If you don't track the results well, it's hard to know what actually worked and what just looked good on a map.
Conditions That Strengthen or Limit Payback
VRT tends to make the most financial sense on fields with meaningful variability, especially:
- rolling loess soils
- fields with sharp texture shifts
- erodible soils
- zones with high organic matter
Research across 21 locations in Louisiana, Mississippi, Missouri, and Tennessee found that sensor-based variable rate nitrogen produced the strongest net returns on erodible soils and in high-organic-matter zones.
The math matters too. Map-based systems need about 11% input savings to break even. Sensor-based systems need about 5% to 11%, depending on imagery resolution.
On highly uniform fields, the return is often weaker. In those cases, waiting until you have more field data can be the smarter move. And if the numbers are still close, USDA NRCS EQIP cost-share under Practice Code 590 may help cover startup costs.
Conclusion: Precision Inputs That Can Pay for Themselves
VRT works because it stops treating every acre the same.
Fields with variable soils don't respond the same way to management inputs. So when you apply one flat rate across the whole field, you can end up spending too much in some areas while leaving money on the table in others. That's why VRT comes back to per-acre return, not just better-looking maps.
Start with the input that has the clearest shot at paying back. Then measure results after harvest and expand only when the field data support it.
FAQs
How do I know if my cotton field has enough variability for VRT to pay off?
Start by looking at within-field yield variability. If a field is mostly uniform, VRT usually won’t do much for you.
Decision tools can help estimate whether VRT will pay off. They often use yield ranges, production costs, lint prices, and field size to run the numbers. But the payoff can vary a lot from one field to the next. Soil texture, landscape, and input prices all shape the outcome.
In one case study, profitable VRT required 11.5% to 92% poor land. And for map-based systems, growers may need about 11% input savings just to break even.
Which input should I start with first when trying VRT in cotton?
Common starting points for VRT in cotton are plant growth regulators, nitrogen, and harvest aids like defoliants.
The right place to start comes down to a few simple things: how much your field varies, what sensing tools you already use, and whether you can build prescription maps you trust. In warm, humid regions, growers often manage nitrogen with sensor-based or plant-based checks because soil tests can be less dependable.
How can I measure whether VRT actually improved profit after harvest?
Use a partial budget to compare the total costs and returns from VRT against your whole-field standard practice. To get net returns for each approach, subtract input costs from revenue.
Use yield maps and application records to track input savings and yield shifts by field zone. That gives you a clearer picture of where VRT pays off and where it may not.
And don’t stop at seed, fertilizer, or chemical costs. Factor in equipment investment and repeat expenses like grid soil sampling or data analysis so you can estimate the true return on investment.