I’d start with a 30–90-day baseline - not an equipment purchase. Cotton spinning automation changes how mills move material, detect yarn faults, and plan maintenance. But the test is simple: does it lower your cost per pound of saleable yarn?
I compare three mill models below, including their labor needs, yarn consistency, downtime, productivity, costs, and training requirements.
Quick Comparison
| Area | Conventional | Partially automated | Connected, highly automated |
|---|---|---|---|
| Material handling | Workers move material | Selected doffing and transport tasks automated | Material movement linked to production records |
| Machine monitoring | Operator rounds and logs | Machine-level sensors and alerts | Shared monitoring across departments |
| Yarn-quality control | Periodic samples | Online fault detection | Quality data linked to lots and timestamps |
| Maintenance | Inspections and repairs | Alerts and some condition checks | Linked sensor data supports maintenance timing |
| Labor and training | More manual handling | Less tending; staff handle jams and alerts | Less routine handling; more data and controls work |
| Cost and productivity | Lower initial spending; delays can limit output | Targeted spending to reduce local delays | Higher spending; results depend on integration and line constraints |
My rule: <u>automate the bottleneck, then check the whole mill’s results</u>. Match yarn count, blend, and machine conditions before comparing gains. Include installation, software, training, safety, and recurring costs - and treat supplier figures as case-specific, not promises.
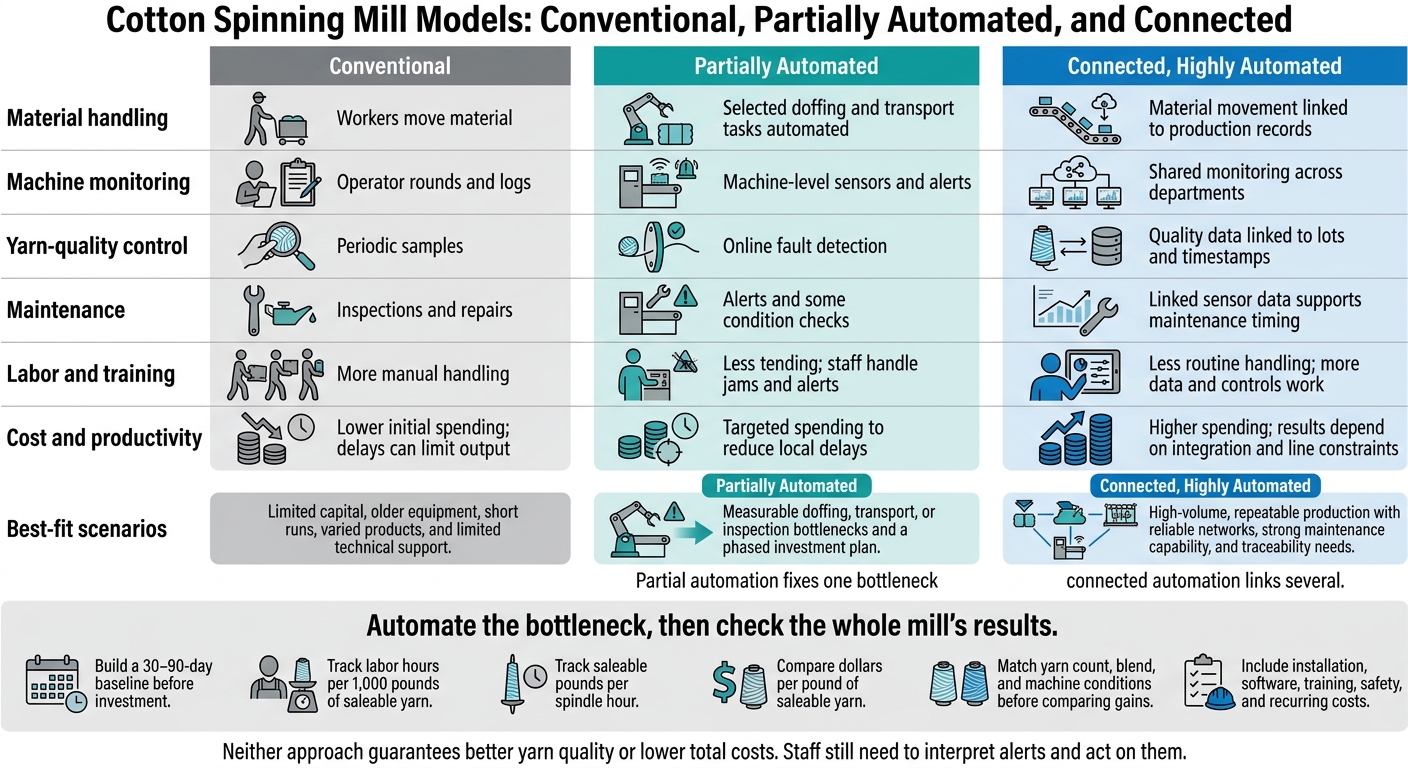
Cotton Spinning Automation: Three Mill Models Compared
1. Conventional Spinning Mills
Labor and Material Flow
Workers use carts or trolleys to move sliver cans, roving, bobbins, and finished cops. They also replenish machines, doff packages, and check for problems during rounds. How well this works depends on operator availability and how often inspections happen.
Measure labor hours per 1,000 pounds of saleable yarn, keeping direct production labor separate from support labor. Track handling time, missed replenishments, and waiting - not just headcount. These handoffs are the first tasks automation changes.
Yarn Consistency and Productivity
Technicians sample yarn to check count, strength, elongation, evenness, thick and thin places, neps, and hairiness. Testing verifies quality, but a failed sample may mean quarantining every pound made since the last passing test. Automated sensing can shorten that detection gap, though laboratory checks still matter.
Track sampling frequency, sample size, turnaround time, rejected or downgraded lots, rework, and end breaks. Measure saleable pounds per spindle hour, not total output alone, to account for losses caused by delayed detection.
Downtime and Maintenance
Manual control also affects reliability. Maintenance includes cleaning, lubrication, inspections, and repairs after faults appear. Condition monitoring uses temperature, vibration, or performance trends to flag problems as they develop.
Manual logs can miss brief stops or record when someone found a fault rather than when it happened. Separate breakdowns from material shortages, power interruptions, and changeovers. Then check log entries against production counters and maintenance work orders to find downtime that went unrecorded.
Implementation Costs and Training
Manual tasks also shape costs and staffing. Compare wages, overtime, transport, testing, spare parts, and waiting costs in conventional operation with a retrofit’s equipment, installation, integration, software, service contracts, and training costs. Use dollars per pound of saleable yarn - not equipment price alone.
Assess workers’ skills in safe handling, lockout/tagout, troubleshooting, and digital recordkeeping. Automation shifts work toward controls, alarms, and data interpretation.
Build a 30–90-day baseline covering representative shifts, cotton lots, maintenance events, and product changes. In later trials, match yarn count, blend, machine type, spindle count, speed, twist, humidity, and reporting period. Define downtime and labor the same way for manual and automated operation, including support staff. Otherwise, shifted work or a different product mix can look like a gain from automation.
sbb-itb-0e617ca
2. Partially Automated Spinning Mills
Labor and Material Flow
Automatic doffing and package transport cut handling work, but workers still clear jams, inspect rejected packages, and move material between unconnected departments. Their work shifts toward piecing, replenishment, and handling exceptions. Ring frames usually gain the most from spindle monitoring and doffing upgrades. Rotor machines may already have automatic piecing or package changeovers.
A 2024 Rieter report on Shunyuan Textile described ROBOdoff on R 36 and R 37 rotor machines, with package changes handled without stopping spinning, but it did not disclose the prior staffing level.
These upgrades improve individual steps while leaving gaps between machines and systems.
Yarn Consistency and Productivity
After handling is automated, further gains come from detecting faults sooner and giving operators clear instructions. Online fault detection and machine alerts point operators toward problems. Set alarm priorities and assign responsibility for each response. Poorly calibrated sensors can trigger frequent false alarms.
Track alarm rate, false-alarm count, response time, first-quality rate, and doff time. Keep ring and rotor results separate.
Downtime and Maintenance
Faster doffing can increase utilization without increasing machine speed. But conveyors, grippers, and sensors also add failure points. Set safe fallback procedures for blocked transport or a lost data link.
An alarm is an alert, not a prediction. Predictive maintenance uses historical and live data to decide when to intervene.
Implementation Costs and Training
Check frame geometry, package dimensions, control-system interfaces, utilities, and transport clearances. Confirm that production, quality, and maintenance systems share data. Otherwise, staff must still enter data manually and reconcile lots.
Budget for interfaces, commissioning downtime, spare parts, and training. Start with a pilot on one machine group. Before changing staffing levels, require operators to demonstrate safe jam clearing, alarm handling, and sensor checks. The next step is to connect these separate controls into a fully networked mill.
Rieter Fully Automated Spinning System
3. Connected, Highly Automated Spinning Mills
Connected mills go beyond machine-level automation. They bring material handling, quality, and maintenance data into a single control layer.
Labor and Material Flow
Connected mills link material movement to production records, so staff can trace packages back to their lots and bale records. That data link sets them apart from partially automated mills.
Teams oversee flow across departments, investigate exceptions, and respond to central alerts. Automation cuts manual handling, but it doesn't remove the need for staff.
Yarn Consistency and Productivity
Link machine quality data to lot records and timestamps so staff can trace quality changes to their source. Online dashboards give teams access to these records for root-cause analysis.
Drawing-frame auto-leveling detects and corrects sliver thickness variation before it reaches roving and spinning. Labs still check yarn properties, including tensile strength under ASTM D2256 or ISO 2062. Before changing quality limits, document sensor calibration and check automated readings against physical samples.
Downtime and Maintenance
Sensors monitor vibration, temperature, and power draw to flag signs of failure early. This gives staff time to act before an unexpected stop. Connected data helps teams schedule maintenance based on machine readings, though the systems that reduce downtime also require integration and training.
Implementation Costs and Training
Budget for integration, cybersecurity, calibration, and training. Set clear rules for who owns production data, who can export it, and who can change settings. Require controlled remote access and recovery procedures.
Train operators to tell process faults apart from faulty sensor readings - and to step in safely when material handling stops.
Compare matched operating conditions, not dashboard totals. To assess whether connected control improved mill performance, keep yarn count (Ne), spinning system, and raw-material mix consistent. Compare kWh/kg using the same production boundary, and treat vendor-reported gains as case-specific.
Costs, System Integration, and Staff Training
Once you’ve chosen the mill model, cost depends on how much of the line you automate. Budget for the full scope, not just the hardware. A retrofit addresses one bottleneck; a connected system links multiple stages. The estimates below cover separate scopes. They are not parts of one combined mill budget.
| Area | Retrofit: estimated capital cost | Retrofit: key readiness requirements | Connected system: estimated capital cost | Connected system: key readiness requirements |
|---|---|---|---|---|
| Material handling | $20,000 for manual-assist handling equipment | Handling clearances | $150,000 for automated guided vehicles or robotics | Coordinated routes and control interfaces |
| Monitoring | $5,000 per machine | Compatible machine connections | $80,000 mill-wide | Compatible connections across equipment |
| Yarn-quality control | $15,000 for add-on sensors | Compatibility with existing controls | $120,000 for an integrated quality-control system | Linked quality and production records |
| Predictive maintenance | $2,000 for handheld vibration tools | Sensor-testing skills | $60,000 for real-time monitoring | Installed sensors and a stable data network |
Keep recurring expenses separate from capital costs. Annual budget allowances may include service and parts at 5%–8% of equipment cost, software and cybersecurity at $10,000–$25,000, calibration at $5,000, and job-specific training at $15,000.
Integration changes how people work, so training needs to match the new control points. Operators need training in exception handling and stop response. Technicians need sensor-testing and calibration skills. IT staff need to understand data flow, network connections, updates, and access controls.
Before startup, check that emergency stops and isolation points are accessible. Maintenance procedures must meet applicable OSHA control-of-hazardous-energy requirements, including lockout/tagout. An emergency stop does not replace safe isolation.
Use a pilot to estimate payback based on verified savings and recurring costs. Measure labor, downtime, and quality gains against the same baseline. Count payroll savings only when payroll costs actually fall. Moving workers into technical roles is redeployment - not an immediate cash saving. Avoid counting the same gains twice across overlapping zones.
Pros and Cons of Each Mill Model
The three models differ mainly in how much control shifts from operators to the system. That shift affects labor, quality, downtime, and productivity.
| Model | Advantages | Disadvantages | Best-fit conditions |
|---|---|---|---|
| Conventional | Low initial technology spending; flexibility for unusual jobs; production can continue through some digital outages. | More manual handling; fault detection depends more on operators. | Limited capital, older equipment, short runs, varied products, and limited technical support. |
| Partially automated | Reduces tending and ergonomic exposure at selected steps while keeping manual flexibility. | A local failure can stop the automated link, though manual fallback limits disruption. | Measurable doffing, transport, or inspection bottlenecks and a phased investment plan. |
| Connected, highly automated | Reduces routine tending by linking material, quality, and maintenance control. | Highest initial spending; network or software failures can disrupt several processes; product changes may require control and software retuning. | High-volume, repeatable production with reliable networks, strong maintenance capability, and traceability needs. |
Partial automation fixes one bottleneck; connected automation links several. But removing a doffing delay won't necessarily increase saleable output if winding still limits production.
Modeled plant comparisons show how much staffing can change.
In Rieter’s modeled 53,000-spindle combed compact-yarn mill, staffing fell from 54 operators to 30, a 44% reduction. This was a supplier-reported comparison, not a guaranteed result.
Neither approach guarantees better yarn quality or lower total costs. Poor cotton selection, worn components, incorrect settings, and weak humidity control can outweigh better monitoring. Compare yarn unevenness, imperfections, end breaks, and first-pass yield alongside cost per pound - not output alone.
Plan for network loss in each area. Define local controls, offline records, and required spare electronics. These tradeoffs shape cost and training decisions and help determine which bottleneck to automate next.
Conclusion: Automate the Bottleneck and Check Results
Automation replaces manual handling and periodic checks with automated movement, continuous monitoring, earlier yarn-quality feedback, and condition-based maintenance. Staff still need to interpret alerts and act on them.
Start by measuring bottlenecks to decide which one to automate first. After the upgrade, compare results with a matched manual baseline before crediting automation. Did the constraint improve - and did overall mill performance improve with it? The goal isn’t more automation. It’s better output from the weakest step.
Expand only when equipment runs reliably, systems share usable data, staff can handle alerts, and measured savings exceed integration and training costs.
FAQs
Which automation upgrade should my mill prioritize?
Start with your mill’s biggest bottleneck. Match the equipment to the problem:
- Labor shortages or high labor costs: Automated doffing and piecing robots.
- High energy use: Energy-efficient air-jet or rotor spinning.
- Yarn consistency: Digital monitoring and inline sensors.
- Unplanned downtime: Predictive maintenance systems.
- Yarn defects: Vision-based quality control and automated cleaning.
Before investing, check machine compatibility and run a break-even analysis to confirm that the expected savings justify the upfront costs.
How can I calculate automation’s payback period?
Calculate ROI (%) = (Net Profit from Equipment / Total Investment Cost) × 100. Total investment should include the purchase price, transportation, installation, foundation work, and loan fees or interest.
Estimate net profit using labor savings, less waste from fewer yarn breaks, and increased output. When calculating operator labor costs, include benefits and overhead - not just wages.
To estimate how long it will take to recover the investment, run a break-even analysis and account for machinery depreciation.
Can I automate older machines without replacing them?
Older spinning frames can often be fitted with automated doffing or digital controls, but the retrofit needs careful planning. Compatibility depends on the machine’s design, power supply, and ability to support modern sensors or data communication protocols.
Before moving ahead, check the spindle count, gauge, and bobbin dimensions. Also account for possible production disruptions, extra floor space, and high implementation costs.