IoT can help cotton growers use less water, spot stress sooner, cut scouting time, and plan harvest with fewer surprises. In the article, I show how field sensors, weather data, GPS equipment, and cloud tools turn raw readings into day-to-day decisions for irrigation, fertility, pest control, yield forecasts, labor, and gin planning.
Here’s the short version:
- Irrigation gets tighter: sensor-based systems cut water use by 12% to 18% on average, and one USDA-ARS study reported cuts of 20% in 2021 and 16% in 2022.
- Zone decisions beat field averages: weekly thermal imagery improved water productivity by 19% in one center-pivot study.
- Pest response gets faster: connected traps and AI tools can flag insect and disease risk in minutes, not days.
- Forecasts get better: AI-based yield tools improved forecast accuracy by 15%, which helps with labor, module hauling, and gin schedules.
- Adoption is still limited: only 13% of Georgia cotton farmers use precision ag tools, mainly because of cost, connectivity, and data concerns.
What matters most is simple: good field data helps growers act sooner and spend with more control on a $/acre basis. In this piece, I focus on the tools being used now, where they help most, and what may come next as edge processing, AI, and more automated field systems spread.
A quick look at the article’s core points:
| Area | What IoT Changes | Key Numbers |
|---|---|---|
| Irrigation | Uses soil moisture, canopy temp, and weather data to guide watering by zone | 12%–18% less water; 20% and 16% cuts in USDA-ARS study |
| Crop stress | Spots heat and moisture stress before visual symptoms | 19% better water productivity in one study |
| Pest monitoring | Sends alerts from traps, sensors, and weather-based risk models | Response moves from days to minutes |
| Yield planning | Uses drone, satellite, and model data for pre-harvest forecasts | 15% better forecast accuracy |
| Adoption limits | Slowed by cost, connectivity, and support gaps | 13% adoption among Georgia cotton farmers |
Bottom line: if I had to sum up the article in one sentence, it’s this: smart cotton fields work best when growers start with steady sensor data, use it to tighten irrigation first, and then build toward pest alerts, yield forecasts, and harvest planning.
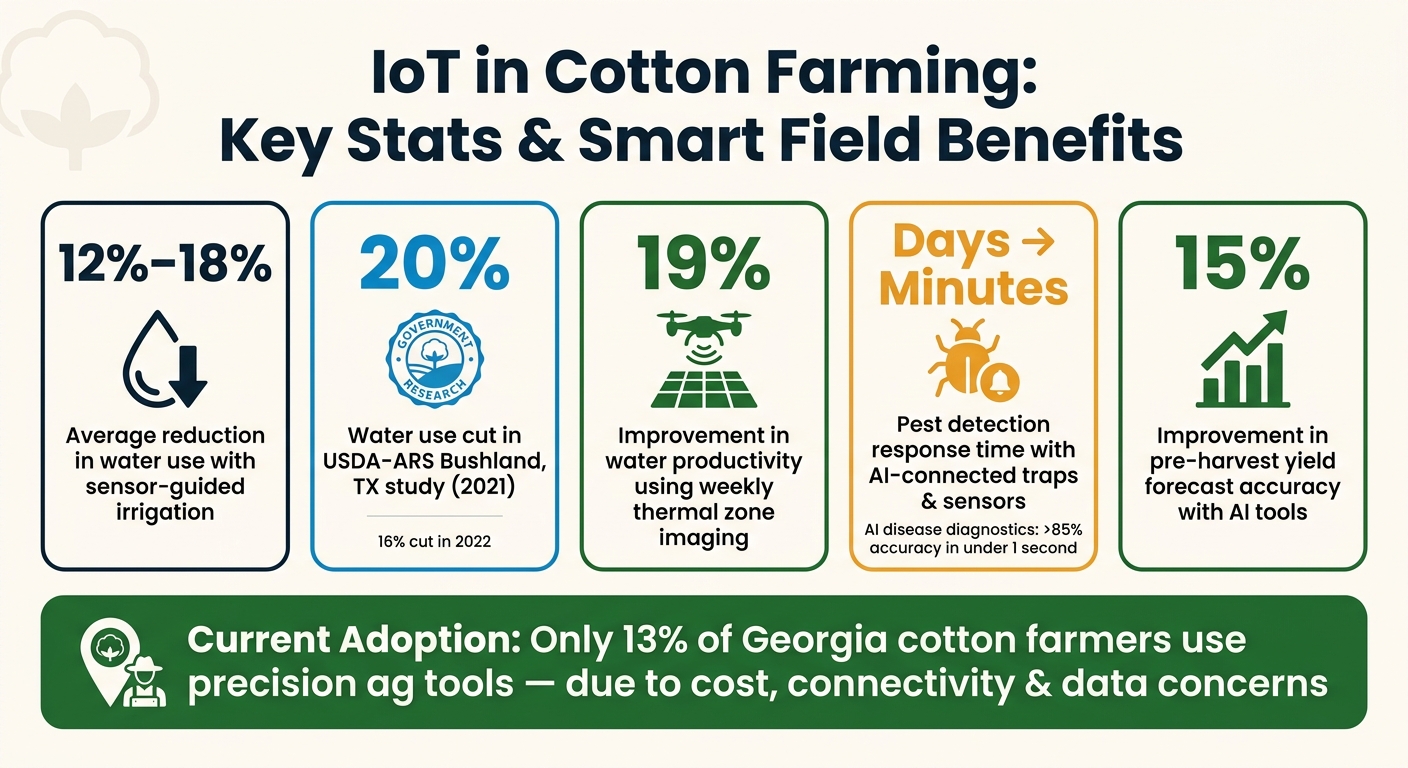
IoT in Cotton Farming: Key Stats & Smart Field Benefits
The Core IoT Tools Used in Cotton Fields
Field Sensors, Weather Stations, and Irrigation Controllers
These are the tools growers lean on for day-to-day decisions. They turn field readings into faster calls on irrigation and scouting.
Soil moisture probes - Time Domain Reflectometers (TDRs) - measure volumetric water content and water depletion at multiple depths, often from 10 to 150 cm. That gives growers a clearer read on when to irrigate and how much water the crop has already used. In a USDA-ARS study in Bushland, Texas, ISSCADA matched manual methods while cutting irrigation water use by 20% in 2021 and 16% in 2022.
Infrared thermometers (IRTs) add a plant-side check. Mounted on center pivot laterals or drones, they measure canopy temperature and support Crop Water Stress Index (CWSI) calculations, which can spot heat stress before it becomes obvious in the field. On-farm weather stations fill in the rest by logging air temperature, relative humidity, solar radiation, and wind speed. Those inputs help estimate evapotranspiration (ETc) and can also help flag conditions linked to pest pressure. Connected pest traps add another layer by warning growers when insect activity starts climbing before damage spreads.
When the sensors point to a problem, irrigation controllers can respond right away. Systems like ISSCADA use sensor feedback to automatically control variable-rate irrigation (VRI)-equipped center pivots, adjusting water depth by zone based on site-specific field needs.
GPS Equipment, Data Platforms, and Farm Connectivity
Collecting field data is only half the job. The other half is moving it to the grower fast enough to act on it.
GPS-guided tractors, planters, sprayers, and harvesters improve pass accuracy. They also build spatial records of yield and biomass, which help define management zones. Those records support variable-rate inputs and make harvest planning more precise.
To move data off the field, farms use tools like LoRaWAN, cellular modems such as LTE-M, and 900 MHz radio modems. These systems send sensor and machine data into cloud dashboards, where growers can check conditions without waiting on manual reports. Some setups also use edge computing, which processes data locally before syncing it to the cloud.
In June 2024, Texas A&M AgriLife Research launched a project with 11 cotton producers across the Texas Coastal Bend. The team built a digital agriculture data hub that merges drone and satellite feeds to deliver daily canopy health updates and lint yield forecasts directly to producers.
Comparison Table: What Each IoT Component Does
Once the hardware is in place, the next step is using the data for irrigation, fertility, and crop-protection decisions.
| Component Type | Measured/Controlled Variable | Typical Location | Communication Method | Common U.S. Cotton Use Case |
|---|---|---|---|---|
| Soil Moisture Probe (TDR) | Volumetric water content | 10–150 cm depths | LoRaWAN, 900 MHz radio | Irrigation scheduling and deficit management |
| Infrared Thermometer (IRT) | Canopy temperature | Mounted on pivot lateral or UAV | Radio, cellular | Crop water stress indexing (CWSI) |
| On-Farm Weather Station | Air temperature, relative humidity, solar radiation, wind speed | Field edge | Cellular, Wi-Fi | ETc estimation and pest monitoring |
| VRI Irrigation Controller | Water application depth | Pivot panel and valves | PLC, cellular | Site-specific water delivery |
| GPS Unit (machinery) | Spatial coordinates, pass data | Tractor, planter, harvester | Satellite, LTE | Yield mapping and management zones |
| Multispectral UAV/Satellite | NDVI, NDMI, LST | Aerial or space-borne | API, cloud upload | Yield forecasting and variable rate fertility |
| Automated Pest Trap/Sensor | Insect count, motion | Field perimeter, canopy level | LoRaWAN, ZigBee | Early warning for bollworms and whiteflies |
sbb-itb-0e617ca
How Sensor Data Improves Irrigation, Fertility, and Crop Protection
Irrigation Scheduling with Soil Moisture and Weather Data
Fixed irrigation calendars miss what's happening in the root zone. That creates a simple problem: one part of the field can get too much water while another slips into stress.
Sensor-guided scheduling changes that. Moisture probes track water in the root zone, while weather-station ET estimates show when the crop is using water faster than the soil can keep up. NDVI can help with early-season irrigation calls. Later in the season, CWSI becomes more useful because canopy stress tells you more.
Weekly zone updates make that signal far more useful. Instead of leaning on static soil maps, growers can recalculate CWSI from current thermal imagery and adjust by zone. In a 12.5-hectare center pivot field, weekly thermal imagery improved water productivity by 19% compared with uniform irrigation. Data-driven irrigation models have also shown an average 12% to 18% drop in total water application while maintaining yield.
The same maps used for irrigation can also show where the crop is most likely to respond to variable-rate fertility.
Variable Rate Fertility, Growth Regulators, and Defoliation
Once water is managed by zone, it makes sense to handle fertility and late-season treatments the same way.
Variable-rate fertility matches nitrogen to zone-level crop demand instead of using one blanket rate across the whole field. Optical sensors that measure chlorophyll content, paired with NDVI from satellite imagery, help line up nitrogen rates with crop demand.
That same field-to-field and zone-to-zone variation also shapes late-season plant management. Drone and satellite imagery, canopy heat maps, and predictive models can help time PGRs and defoliants by zone. A Texas A&M AgriLife Research project involving 11 cotton producers across the Texas Coastal Bend used these tools to support PGR timing, defoliation timing, and lint yield forecasting. Prescription maps built from this data help applicators match the rate to each part of the field instead of leaning on a field average.
These results help explain why sensor-guided decisions beat calendar-based management across the season.
Comparison Table: Calendar-Based Practices vs. Sensor-Guided Decisions
| Decision Area | Calendar-Based / Manual | Sensor-Guided / IoT |
|---|---|---|
| Irrigation timing | Fixed intervals or visual inspection | Triggered by root-zone moisture thresholds and ET estimates |
| Water use | Higher risk of overwatering or late stress | 12% to 18% average reduction in total water application |
| Water productivity | Uniform irrigation baseline | Up to 19% improvement with weekly zone updates |
| Fertility application | Uniform rate across all zones | Variable rate guided by NDVI and chlorophyll sensors |
| PGR and defoliant timing | Based on calendar date or rough visual estimate | Guided by canopy-condition data and predictive models |
| Decision speed | Delayed, waiting for visible symptoms | Real-time, based on sub-visual stress indices |
IoT for Pest Alerts, Yield Forecasting, and Labor Efficiency
Connected Pest and Disease Monitoring
The same field network that handles water and fertility can also spot pest and disease risk before damage spreads. When pest data, yield data, and machine data all feed into one platform, growers get a single view of the field instead of juggling separate jobs.
High-resolution sensors can detect flying insects and cotton bollworms in real time and send alerts with field location data to a central gateway. AI disease tools can identify risk in under a second with accuracy above 85%. That cuts response time from days to minutes.
Weather-based models look at temperature, humidity, and rainfall to flag outbreak risk. If a model marks one zone as high risk, scouts can go straight there instead of walking the whole operation. And when sensors pick up an infestation, targeted drone sprays can treat only the affected zones and cut chemical use.
That same flow of data doesn’t just trim scouting work. It also helps with harvest timing and gin logistics.
Yield Forecasting and Equipment Efficiency
Once crop stress and pest pressure are tracked in real time, harvest planning gets a lot sharper. Pre-harvest yield estimates help growers plan labor, hauling, and gin scheduling before harvest pressure starts to pile up.
Variable-rate application matches treatment to the needs of each zone. AI-driven yield prediction tools have improved forecast accuracy by 15%. In plain terms, that means better planning before crews and machines hit the field.
The same data stream also sets up the next move: faster edge processing and more automated field decisions.
Comparison Table: Manual Monitoring vs. IoT-Enabled Operations
The move from manual checks to connected alerts changes both response speed and labor use.
| Area | Manual Operations | IoT-Enabled Operations |
|---|---|---|
| Detection and response | Periodic scouting; pests often identified after visible damage; response measured in days | Real-time alerts with field location; AI disease diagnostics in under a second; response measured in minutes |
| Labor hours | High; physical scouting across entire fields required | Reduced; automated alerts direct labor to high-risk zones only |
| Documentation | Handwritten logs; prone to error and inconsistency | Digital records updated automatically; fewer manual entries, faster decisions |
| Machine use | Uniform field-wide passes | GPS-guided variable-rate application matches treatment to zone need |
| Consistency | Subjective; based on scout experience and judgment | Objective; based on NDVI, CWSI, and WSI thresholds |
The Road Ahead for Smart Cotton Fields
What Comes Next: AI, Edge Computing, and Autonomy
As cotton sensor networks mature, the next move is simple: turn raw field data into actions farmers can use without delay.
One of the clearest near-term wins is edge-based pest detection. In September 2025, a research team led by Georgia Southern University and the City of Millen piloted the FarmSense FlightSensor in Jenkins County, Georgia. The AI-powered system used infrared beam sensors and machine learning algorithms to identify the wingbeat patterns of pests such as stink bugs and bollworms. That helped local farmers fine-tune pesticide use across eight large cotton fields and treat only outbreak zones instead of spraying everything.
The same data that helps with irrigation is also feeding prediction tools for crop timing and harvest planning. At Texas A&M AgriLife, drone and satellite feeds are being combined into predictive crop models for PGR timing, defoliation, and yield forecasts. In plain English, the system turns aerial data into field-specific guidance for crop timing and yield planning.
Farther down the road, software that coordinates irrigation, scouting, and drone missions across fields could help growers decide where to send limited resources first, whether that's water or scouting drones across multiple plots. Longer term, the roadmap also includes fully autonomous robotic harvesters and cotton tracking from field to gin.
Adoption Barriers and How Growers Can Prioritize Rollout
Tech is moving fast. Adoption is not.
Right now, only 13% of Georgia cotton farmers use precision agriculture practices. The reasons are pretty direct: high upfront costs, spotty rural connectivity, concerns about who owns the data, and limited local support for irrigation, scouting, and harvest planning.
A practical rollout starts small. Many growers will get the fastest payback by starting with irrigation monitoring and machine telematics, then layering in pest sensors and yield tools. Those first systems can cut water use and fuel waste. And there’s a simple point here: clean, steady field data beats a fancy model built on bad inputs. Reliable sensor placement and steady scouting logs often do more than a complex system fed by noisy or missing data.
Conclusion: Using Field Data to Improve Harvest and Gin Planning
Better field data doesn’t stop helping once the crop is made. It also changes how harvest and post-harvest work gets planned.
Accurate yield forecasts give growers a better shot at scheduling hauling and ginning early, which can reduce bottlenecks and make intake planning smoother. Field-level IoT data helps growers plan harvest and gin intake with fewer surprises.
The table below shows how smart-field tools can shape grower outcomes over time.
| Capability Tier | Smart Field Capability | Expected Grower Outcome |
|---|---|---|
| Near-Term | Edge-based pest sensors (wingbeat detection) | Reduced pesticide use; localized treatment |
| Near-Term | Dynamic irrigation re-zoning (UAV/satellite) | Better zone-level water placement |
| Mid-Term | Predictive models for crop growth and yield | Optimized defoliation timing and PGR application |
| Mid-Term | Multi-agent control software for resource coordination | Automated prioritization of field tasks |
| Long-Term | Fully autonomous robotic harvesting and weeding | Lower labor costs; 24/7 field operations |
| Long-Term | Tracking cotton from field to gin | Improved fiber quality grading and logistics |
FAQs
What IoT tools should I install first in a cotton field?
Start with soil moisture sensors and a wireless sensor network so you can get real-time, field-level data. That gives you a solid starting point, cuts down on manual checks, and helps you irrigate with more precision.
From there, connect those sensors to smartphone-compatible irrigation controllers so you can monitor conditions and make adjustments remotely. Once that setup is in place, add aerial monitoring - like drones or satellite data platforms - for a better view of crop conditions and more targeted, site-specific management.
How much can IoT really save on water and input costs?
IoT can improve efficiency in cotton farming in a clear, measurable way.
For water management, sensor-based precision irrigation can cut water use by 12% to 30% without reducing yield. That matters a lot in cotton, where overwatering can waste money and strain farm resources.
It can also help farmers use inputs with more care. Sensor-driven thresholds have increased net returns by up to $142.00 per acre. And when irrigation, fertilizer, and pesticide use are managed with better precision, overall input costs can go down.
Can IoT systems work on farms with weak rural connectivity?
Yes. IoT systems can still work in areas with weak or spotty connectivity.
In many cases, they use a network connection to sync data with cloud platforms for live monitoring. But a well-built system doesn’t stop working just because the signal gets shaky. It includes fallback behavior, so the device can keep doing its job when the connection slows down, cuts in and out, or drops completely.
In some setups, microcontrollers can also handle tasks locally instead of waiting on the cloud. That said, unstable links can still cause hiccups, and in some cases they may require manual resets.