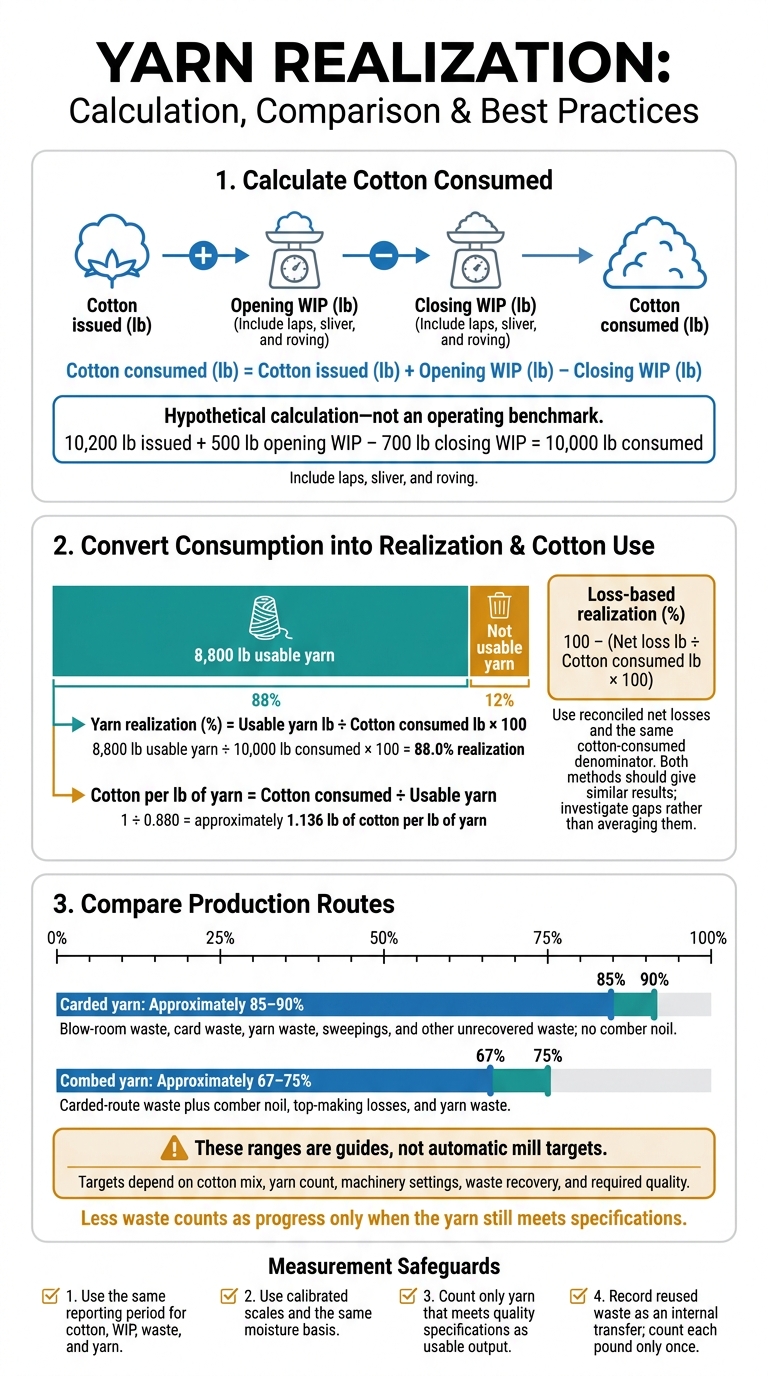
Yarn realization measures how much cotton becomes usable yarn - not how much lint a gin produces. I calculate it by dividing usable yarn weight by cotton consumed, adjusted for work in process, then multiplying by 100. At 88% realization, you need about 1.136 lb of cotton per lb of yarn.
I focus on three checks to reduce cotton use without sacrificing quality:
- Measure correctly: Match reporting periods and moisture levels, reconcile inventory and waste, and count reused fiber only once.
- Find the losses: Review cotton quality, bale mixes, cleaning, carding, combing, spinning, and winding. Carded yarn typically yields about 85–90%; combed yarn about 67–75%. These are guides, not fixed targets.
- Test changes: Adjust one main variable at a time, repeat trials, and check yarn strength, evenness, defects, and customer requirements.
My rule: <u>less waste counts as progress only when the yarn still meets specifications</u>. Track yield, cotton cost per pound of usable yarn, and quality together.
How to calculate cotton contribution and steps for Yarn realization.
sbb-itb-0e617ca
How to Calculate Yarn Realization and Cotton Use
Yarn Realization: From Cotton Consumed to Usable Yarn
Use the same reporting period for cotton, work in process (WIP), waste, and yarn. Calculate cotton consumed with this formula:
[ \text{Cotton consumed (lb)} = \text{Cotton issued (lb)} + \text{Opening WIP (lb)} - \text{Closing WIP (lb)} ]
Include all in-process stock, including laps, sliver, and roving. Count only yarn that meets quality specs and is ready for sale or shipment. Leave out defective, held, or unreconciled material unless the mill’s accounting policy treats it as usable output. Once you’ve calculated consumption, you can trace where cotton is lost.
Weigh all material in pounds using calibrated scales. Record tare weight, time, and location, and use the same moisture basis throughout.
Direct-Weight and Loss-Based Methods
Mills use two methods: one for reporting yield and another for tracing losses.
| Method | Required inputs | Formula | Best use | Common measurement errors |
|---|---|---|---|---|
| Direct-weight | Cotton consumed, including WIP adjustments; usable yarn | Usable yarn lb ÷ cotton consumed lb × 100 | Monthly performance reporting and production-cost analysis | Ignoring WIP or weighing yarn before final sorting |
| Loss-based | Same cotton consumed; all reconciled net losses | 100 − (net loss lb ÷ cotton consumed lb × 100) | Finding where yield is lost | Missing waste, double-counting reused waste, or mixing stage-input and total-input percentages |
Record reused waste as an internal transfer so you count each pound only once. Use the same cotton-consumed denominator for every loss rate. Both methods should give similar results. If they don’t, investigate the gap rather than averaging the numbers.
Example: Yarn Yield and Cotton Use
Hypothetical calculation - not an operating benchmark: 10,200 lb issued + 500 lb opening WIP − 700 lb closing WIP = 10,000 lb consumed. 8,800 lb usable yarn ÷ 10,000 lb × 100 = 88.0% realization; 1 ÷ 0.880 = approximately 1.136 lb of cotton per lb of yarn.
Carded vs. Combed Yarn Yield
| Production route | Main waste categories | Indicative realization |
|---|---|---|
| Carded yarn | Blow-room waste, card waste, yarn waste, sweepings, and other unrecovered waste; no comber noil | Approximately 85–90% |
| Combed yarn | Carded-route waste plus comber noil, top-making losses, and yarn waste | Approximately 67–75% |
Combing removes more short fibers and impurities, so a lower realization can be normal. These ranges are guides, not automatic mill targets. Set targets based on the cotton mix, yarn count, machinery settings, waste recovery, and required quality.
The next section breaks down the stage-by-stage waste behind these differences.
Where Cotton Is Lost and What Affects Yield
Waste by Process Stage
Some waste is needed to remove trash and short fibers. But excess cleaning or poor settings can also pull out usable fiber. That lowers yield and increases cotton use per pound of usable yarn. The table shows where losses occur, how to measure them, and what can be recovered.
| Process stage | Waste streams | Likely causes and quality risks | Measurement method | Recovery route |
|---|---|---|---|---|
| Opening and blow room | Trash, motes, dust, lint tufts, sweepings, filtration waste | High-trash cotton needs cleaning; aggressive beating or excess airflow can remove good fiber | Weigh each extraction stream with calibrated scales; collect sweepings by area and shift; weigh filter waste after consistent dewatering or conditioning | Recover only clean fiber; keep most dust and contaminated sweepings out of the mix. |
| Carding | Card flats, undercard waste, fly, suction waste | Worn clothing, incorrect flat settings, or excess taker-in action can increase fiber loss and neps | Weigh flat and undercard waste separately; test fiber length and trash content | Reuse only clean, approved material. |
| Combing, where used | Noil and preparation waste | Preparation and noil settings affect short-fiber removal; removing too little can hurt evenness and appearance | Weigh noil against comber feed; compare with yarn-quality results | Reuse in coarser yarns or nonwovens only if clean and approved. |
| Drawing and roving | Sliver, roving, piecing waste, fly | Uneven feeding, drafting faults, or poor alignment increase breaks and variation | Record waste by machine and shift, alongside break rates | Reuse soft waste only if clean and approved. |
| Spinning | Pneumafil, hard waste, cop waste, end-break waste | Traveler or spindle problems and drafting faults increase breaks | Weigh by machine and reason; track end breaks | Test pneumafil before reuse; reprocess or recycle hard waste. |
| Winding and packing | Clearer cuts, splice waste, cone remnants, rejected yarn | Over-sensitive clearing, poor splicing, and handling damage can reject acceptable yarn | Record waste and rejected cones by reason | Reprocess or recycle rejected yarn; do not count it as usable output. |
Waste sales recover value, but they don't improve realization. Track unexplained loss as the residual after accounting for known outputs, waste, and inventory changes. A persistent gap needs investigation - not a label of normal waste.
Losses at each stage also depend on the cotton, especially its trash content and fiber quality.
Cotton Quality and Bale Mixing
Trash and contamination mean more cleaning. Short, weak, or uneven-length fibers are more likely to end up as fly, noil, or breakage waste. Micronaire reflects fineness and maturity; immature fibers can cause neps and dyeing problems.
Sample the bale lot for staple length, strength, micronaire, maturity, uniformity, short-fiber content, trash, contamination, and moisture. Build a traceable mix that suits the yarn count and spinning route, and avoid abrupt blend changes. Gin handling also affects fiber damage, trash, neps, and contamination.
Once the blend is set, machine settings determine how much usable fiber makes it through.
Machine Settings and Yield Measurement Errors
Match cleaning intensity to the cotton - not maximum extraction. Check grid settings, card clothing and flats, suction, airflow, filters, and air leaks. For combing, review preparation, feed, nipper, detaching, and top-comb settings together. Comber noil often runs 15–20% of feed; lower it only if yarn quality still meets spec.
When end breaks increase, inspect drafting alignment, cots, aprons, travelers, and spindles. At winding, check clearer sensitivity and splice quality before accepting higher rejection rates.
Before changing settings, rule out moisture shifts, inventory timing, blend changes, tare errors, and unrecorded waste. Compare machines and shifts against their own verified baselines. Check waste composition alongside yarn strength, unevenness, imperfections, hairiness, and end breaks. Lower waste isn't an improvement if more yarn fails specification.
How to Improve Yield Through Controlled Mill Trials
Use the loss map above to test the changes most likely to increase usable yarn output. Establish a baseline for each yarn count, blend, and process route. Track realization, waste, cotton use, quality, and machine performance.
Change one major variable at a time, keeping speed, bale mix, and test method constant. Approve a change only after it delivers repeatable results across multiple shifts or batches.
Choose Cotton Based on Usable Yarn Output
Judge each cotton lot by the usable yarn it can produce - not bale price alone. Set acceptance limits based on the yarn specification, then check them through mill testing. Keep bale mixes stable between lots.
Compare lots using this calculation: cotton cost per pound of usable yarn = cotton cost per pound ÷ expected realization, with realization expressed as a decimal. Include cleaning loss, card waste, comber noil, yarn waste, waste resale value, and reprocessing costs.
Start at the process stage losing the most usable fiber.
Adjust Cleaning to Reduce Good-Fiber Loss
Focus on the blowroom, carding, and combing losses found in the waste review. Record the starting settings, keep a control lot, and change only one setting group at a time. Use the table to track each trial, its owner, and how results will be checked. The expected effects show the likely direction of change - not a guarantee.
| Intervention | Expected yield effect | Quality risk | Required measurements | Responsible process area | Verification test |
|---|---|---|---|---|---|
| Stabilize the bale mix and separate high-trash cotton | Less variation and possibly higher realization | Inconsistent quality if mixing is poor | Bale HVI data, trash, moisture, realization by mix | Materials and blowroom | Compare several lots against the same yarn-quality limits |
| Reduce over-aggressive blowroom cleaning | Less lint loss and higher yield | More trash, neps, or downstream defects | Waste weight, lint content, trash, neps, fiber length | Blowroom and quality | Test yarn; inspect card sliver and fabric performance |
| Tune card settings and suction | Less card waste and better fiber retention | Higher neps or unevenness | Card waste, sliver U%, neps, suction, end breaks | Carding and maintenance | Compare trial and control lots under equal production conditions |
| Set comber noil to the lowest level that still meets yarn spec | Higher yield when excess noil is removed | More short fibers, hairiness, imperfections, or weaker yarn | Noil percentage and composition, combed sliver quality, yarn tests | Combing and quality | Trial multiple noil levels; check yarn and downstream results |
Approve settings only when quality stays within specification. Check strength, evenness, imperfections, hairiness, neps, end breaks, winding/package performance, and weaving or knitting performance where relevant. Lower extraction alone does not prove that the process has improved.
Track Waste and Investigate Yield Changes
After each trial, add the results to routine shift reporting. Record waste by process stage each shift or day, using separate norms for carded and combed yarn. Reconcile cotton input, yarn output, waste, internal reuse, and inventory changes. Don’t count recirculated material twice.
Investigate the largest variance by machine, shift, mix, or product. Standardize successful settings only after repeated checks confirm the results. Review the dashboard monthly with production, quality, maintenance, and materials staff. Report realization, cotton use per pound of yarn, waste variances, quality exceptions, and open actions.
Conclusion: Track Yield, Cotton Use, and Quality Together
After mill trials and waste reviews, measure success by usable yarn, not realization alone. Required losses depend on cotton quality and the spinning route.
Accept a change only when repeated runs confirm lower cotton use while the yarn still meets specs. Compare input and output on the same moisture basis: added moisture does not add fiber.
Use this end-of-period check to reconcile yield, waste, and quality:
- Cotton consumed: Record pounds used, cotton lot, reporting period, and weighing basis.
- Usable yarn: Record approved finished yarn separately from rejected or downgraded output.
- Stage waste: Weigh blowroom, card, comber, spinning, winding, and other losses separately.
- Reused waste: Record its quantity and destination. Don’t count it as finished yarn.
- Inventory and moisture basis: Reconcile receipts, opening and closing stocks, work in process, and moisture adjustments.
- Quality checks: Confirm count, strength, evenness, appearance, defects, and customer specs.
- Cotton per lb of yarn: Divide cotton consumed by usable yarn, then review the result alongside quality.
FAQs
How do I set a realistic yarn realization target?
Calculate your baseline yarn realization by dividing the weight of yarn produced by the weight of cotton consumed, then multiplying by 100.
Typical industry benchmarks are 85%–90% for carded cotton yarns and 67%–75% for combed cotton yarns.
Use machine efficiency, operator skills, and raw material quality to set targets that stretch your team without putting them out of reach. Track performance against these benchmarks, and adjust targets based on actual output to support steady improvement.
How can I tell if waste contains recoverable fiber?
Classify the waste and check its composition. Soft waste, such as sliver bits, roving ends, and roller waste, can often be reused. Hard waste cannot be recycled back into the spinning process.
Track weight losses during blow-room processing, carding, and combing. Use the Advanced Fiber Information System (AFIS) to assess fiber characteristics and a Shirley Analyzer to measure non-lint content. These tests help separate impurities from usable fiber.
When does higher yarn realization stop saving money?
Higher yarn realization stops saving money when added processing costs outweigh the value of better quality. Removing just 1% more waste than specifications require can cut profitability.
Combing removes 15% to 20% of the input as noil. Mills must weigh that yield loss against the smoothness and strength customers need. If premium quality isn’t required, removing more short fibers or impurities adds no financial value.