I check five cotton sliver parameters before release - not just average weight. My starting point: compare carded, breaker-drawn, and finisher-drawn samples after 24 hours at 68 ± 3.6°F and 65 ± 2% relative humidity.
Here’s what I look for:
- Linear density: Does average mass per unit length meet the target?
- Mass unevenness: What do U% and CVm% show about thick and thin sections?
- Short- and long-term variation: Is the problem local, repeating, or drifting over time?
- Fiber alignment: Has drawing straightened fibers without adding damage?
- Neps, trash, and dust: Is cleaning removing contamination without excess fiber loss?
An acceptable average can still hide uneven sliver. That’s why I use matched samples across cans and stages, verify suspect results, and change one setting at a time. My release rule: <u>retest before approval</u>, using mill and customer limits - not a universal cutoff.
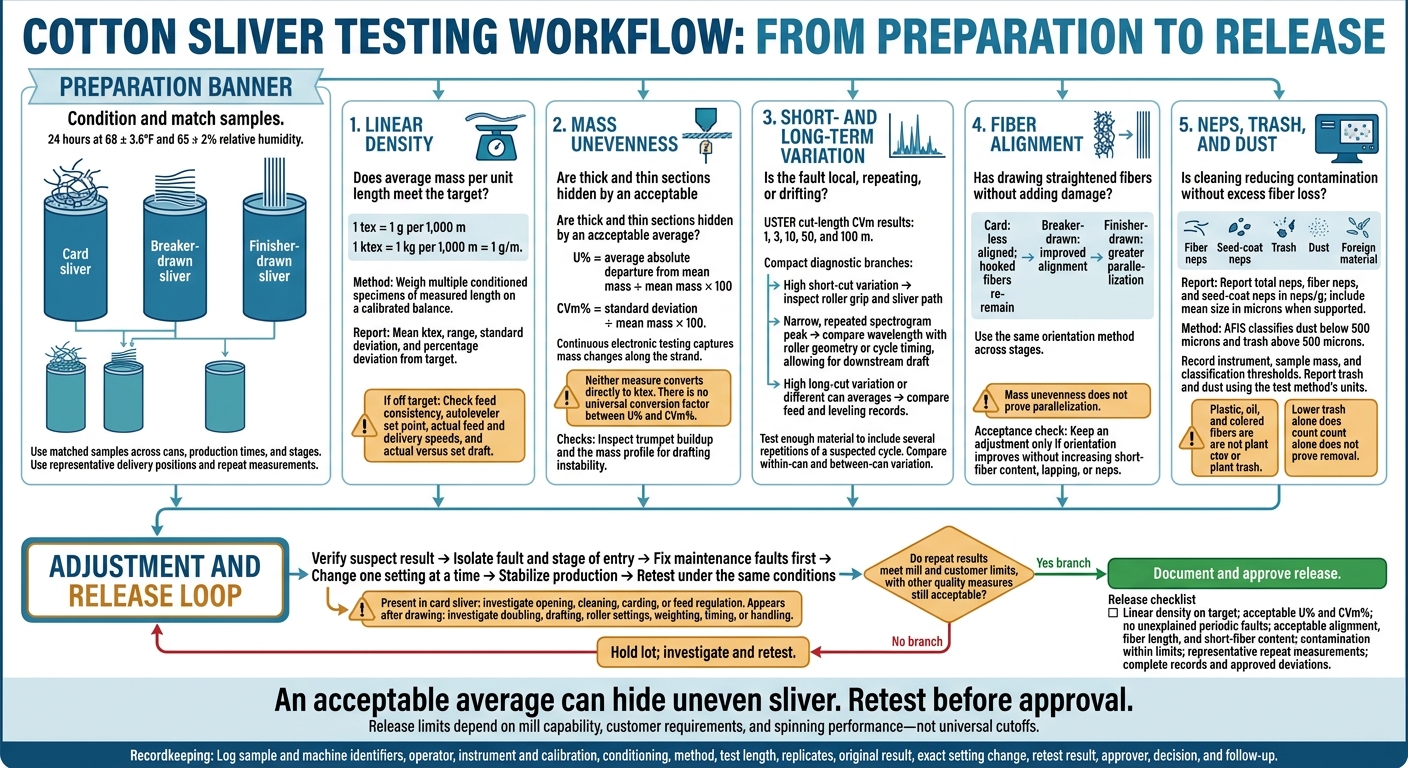
Cotton Sliver Testing and Release Workflow
Cotton Sliver Grain per Yard Testing| Sliver Testing| Roving Testing| Wrapping drum| Textile Pak.
sbb-itb-0e617ca
Linear Density, Mass Unevenness, and Weight Variation
After conditioning the samples, check average weight error separately from unevenness along the strand.
Linear Density: Measure Mass per Unit Length
Linear density measures average sliver weight - not evenness. One tex equals 1 g per 1,000 m; 1 ktex equals 1 kg per 1,000 m, or 1 g/m. Use the mill’s specified sliver linear density, and don’t confuse it with fiber fineness.
Collect multiple conditioned specimens of measured length from different cans and production times. Weigh them on a calibrated balance, then report the mean ktex, range, standard deviation, and percentage deviation from the target.
If the mean misses the target, check feed consistency, the autoleveler set point, and actual feed and delivery speeds. Compare actual draft with set draft, too. Slip or incorrect speed feedback can cause a mismatch.
Mass Unevenness: Understand U% and CVm%
Continuous electronic testing tracks mass changes along the strand that cut-and-weigh specimens may miss. U% is the average absolute departure from mean mass divided by the mean, multiplied by 100. CVm% is the standard deviation divided by the mean, multiplied by 100.
Neither measure converts directly to ktex, and there’s no universal conversion factor between U% and CVm%. Heavy and light sections can cancel each other out, giving an acceptable average even when evenness is poor.
| Measure | What it tells you | What to check |
|---|---|---|
| Linear density, ktex | Average weight against target | Verify actual draft |
| U% | Average relative mass departure | Inspect for trumpet buildup |
| CVm% | Relative spread of mass | Review the mass profile for drafting instability |
Short- and Long-Term Variation: Trace Process Faults
Variation-length analysis helps separate local faults from long-range drift. Short cuts reveal local instability; long cuts reveal drift. USTER systems report cut-length CVm results at 1, 3, 10, 50, and 100 m.
Test enough material to include several repetitions of a suspected cycle. Use a spectrogram to confirm periodic faults rather than random variation.
| Fault signal | Corrective check |
|---|---|
| High short-cut variation; long-cut results relatively normal | Inspect roller grip and the sliver path for local drafting instability |
| Narrow, repeated spectrogram peak | Match wavelength to roller geometry or cycle timing, allowing for downstream draft |
| High long-cut variation or different can averages | Compare feed and leveling records across cans and production times |
| Variation increases after coiling or transport | Compare samples before and after the handling point |
| High readings on only one instrument | Run a control sample on a verified instrument |
Before adjusting the process, compare variation within each can with differences between cans. A fault confined to one can points toward local drafting or handling. The same pattern across several cans points toward a machine-level issue. Thick and thin sections can disrupt fiber control during later drafting and increase the risk of yarn thick and thin places.
Once weight variation is stable, check whether drafting is also keeping fibers parallel.
Fiber Alignment and Parallelization
Once weight variation is under control, check whether drafting has straightened the fibers.
Alignment and parallelization result from carding and drawing. They affect drafting stability, sliver cohesion, and yarn uniformity, but they’re different from fiber length distribution, length uniformity, and short-fiber content.
Measure Fiber Orientation Across Drawing Stages
Use the same orientation method to test card, breaker-drawn, and finisher-drawn sliver so you can compare results. Explain what the method measures and where it falls short. Mass unevenness can support an assessment of drafting performance, but it doesn’t prove parallelization.
| Stage | Orientation trend | Test focus |
|---|---|---|
| Card sliver | Less aligned; hooked fibers remain | Establish baseline orientation and hook content |
| Breaker-drawn sliver | Improved alignment | Check alignment gains from initial drawing |
| Finisher-drawn sliver | Greater parallelization | Verify further straightening and alignment |
Adjust Drafting to Limit Fiber Damage
Compare before-and-after samples from the same lot. Check draft settings, including roller spacing and top-arm load, against the characteristics of the fibers being processed. Fiber length alone doesn’t justify heavier drafting. The goal is controlled fiber flow, not maximum parallelization.
Retest after changing settings. Keep a change only if orientation improves without increasing short-fiber content, lapping, or neps.
If orientation improves but defect counts rise, check cleaning performance next.
Residual Neps, Trash, and Cleaning Performance
When alignment improves but defects remain, compare incoming cotton, card sliver, and drawn sliver from the same production run. Lower trash and dust levels suggest better cleaning. Higher fiber-nep counts suggest processing damage. Use matched samples from the same lot, and repeat tests across cans before judging the change.
Measure Neps, Trash, and Dust Separately
Report total neps, fiber neps, and seed-coat neps in neps/g. Include mean size in microns when the method supports it, and record the instrument, sample mass, and classification thresholds. Use the test method’s definitions for dust and trash: AFIS classifies dust below 500 microns and trash above 500 microns.
| Category | Typical source | Useful measurement | Likely carding response |
|---|---|---|---|
| Fiber neps | Entangled fibers; stress during opening, carding, or drafting | Neps/g; mean size or size classes when available | Check feed uniformity, clothing condition, cylinder-to-flat settings, and excessive mechanical action before increasing cleaning intensity |
| Seed-coat neps | Seed-coat fragments with attached fibers | Neps/g; size distribution where supported | Inspect licker-in and cylinder-to-flat action, waste extraction, and clothing; avoid settings that remove excessive good fiber |
| Trash | Leaf, bark, stem, seed fragments, or other visible plant matter | Particles/g, particle-size classes, percentage area, or trash grade | Review feed preparation, grid bars, licker-in action, flat settings, suction, and waste removal |
| Dust | Fine soil, short fibers, and small particulate matter | Particles/g or mass/g, depending on method | Check suction, filters, airflow, duct leakage, and cleaning efficiency; excessive suction can increase fiber loss |
| Foreign material | Oil, plastic, colored fibers, or other noncotton matter | Count, mass, or visual classification | Trace the source through bale handling, blending, machine maintenance, and housekeeping |
Keep these categories separate. Seed-coat neps are harder to remove than fiber neps. Record visible foreign material separately, using visual findings or the method’s stated percentage basis. Plastic, oil, and colored fibers should not be classified as plant trash.
Balance Cleaning and Fiber Protection
Lower trash alone does not prove better carding quality. If trash drops while fiber neps, short-fiber content, or waste increase, check for excessive mechanical action. Persistent seed-coat neps point to raw-material contamination or incomplete removal. Drawing-stage changes can also affect apparent counts, so a lower drawn-sliver result does not, by itself, prove removal.
- Inspect: Before increasing cleaning intensity, check clothing wear and loading, flat settings, cylinder and licker-in speeds, suction, filters, and waste discharge.
- Adjust: Fix maintenance faults first. Then change one variable at a time.
- Retest: Once production stabilizes, repeat matched tests. Keep the change only if contamination improves without exceeding limits for fiber loss, short fibers, neps, or downstream yarn defects.
If contamination still misses the target after these checks, move to process adjustments.
Process Adjustments and Sliver Release
Troubleshoot Test Results in Order
If the lot still misses its target after cleaning checks, verify the result and isolate the fault before changing machine settings. Keep test settings unchanged.
Check sliver from card to final draw in this sequence: linear density, evenness, variation pattern, alignment, then contamination. This helps pinpoint where the fault enters the process.
A defect already present in card sliver points to opening, cleaning, carding, or feed regulation. If it appears after drawing, check doubling, drafting, roller settings, weighting, timing, or post-draw handling. Compare multiple machines and delivery positions before treating the fault as a material or blend issue.
| Observed result | Check first | Confirmation |
|---|---|---|
| High linear-density variation | Irregular feed, autoleveler calibration, and roller slippage | Retest linear density and CVm% across cans and positions |
| Repeating mass defects | Defect wavelength against roller circumference, gearing, and settings | Verify peak removal over sufficient test length |
| Poor alignment | Draft distribution, roller spacing, pressure, and delivery tension | Confirm better alignment without higher CVm% or short-fiber content |
| High fiber neps | Clothing condition, card settings, feed uniformity, and cotton maturity | Compare nep counts and fiber damage across stages |
| High seed-coat neps | Incoming-lot contamination and seed-coat breakage during cleaning | Repeat counts and mean sizes across cans |
| Excessive trash | Feed cleanliness, suction, filters, and waste extraction | Retest trash and dust separately; verify fiber length |
Retest and Record Each Adjustment
Once you've isolated the fault, change one setting at a time and retest under the same conditions. Compare the mean, range, and repeatability - not just the best single result. Accept the improvement only if other quality measures stay within limits. Hold the lot if results remain inconsistent.
Record the date, time, machine, passage, delivery position, can or lot, blend, operator, instrument, calibration status, conditioning, method, test length, and replicate count.
Keep the original result, exact setting change, new result, approver, acceptance decision, and follow-up requirements. These records support shift handoffs and trend reviews.
Conclusion: Sliver Release Checklist
Release the lot only after retesting confirms the correction. Check that linear density meets its target, U% and CVm% are acceptable, and no unexplained periodic faults remain. Also confirm acceptable alignment after drawing, fiber length, and short-fiber content.
Contamination must meet release limits, with results supported by representative cans, delivery positions, and repeat measurements. Complete the test records and document any approved deviation and its disposition. Base release limits on mill capability, customer requirements, and spinning performance - not universal thresholds.
FAQs
How many sliver samples should I test per lot?
Test enough sliver samples to represent the full lot. Take samples from several positions - at least the top, middle, and inner parts of the supply - instead of relying on one spot. Sampling across the lot helps make measurements more reliable and spot unevenness.
How do I set sliver quality limits for different yarn counts?
Compare results with global standards such as USTER STATISTICS and contract requirements. Use HVI and AFIS data on fiber maturity, length, and trash content to set processing intensity.
For carded yarn, aim for sliver impurities below 0.15% and CVm% below 3%. For finer yarns above 50s count, consider combing to improve length uniformity and strength. Use draw frame autoleveling to correct variation in mass per unit length.
How can I tell whether a sliver defect will affect yarn quality?
Check for neps, sliver unevenness, and impurities. These defects can create weak spots, uneven dye absorption, and more breaks during spinning. Even small differences in sliver density or fiber alignment become more pronounced during drafting.
A 0.3% increase in sliver mass variation (CVm%) can lead to an 18% increase in yarn defects.