Better cotton data means lower cost per bale and more room for premium sales. I’d boil the article down to this: when farms, gins, warehouses, and merchants all work from the same bale record, they move cotton with fewer delays, fewer mistakes, and a better shot at stronger prices.
Here’s the short version:
- One bale ID ties everything together. The Permanent Bale Identification, or PBI, links gin records, USDA HVI classing, warehouse receipts, and merchant sales data.
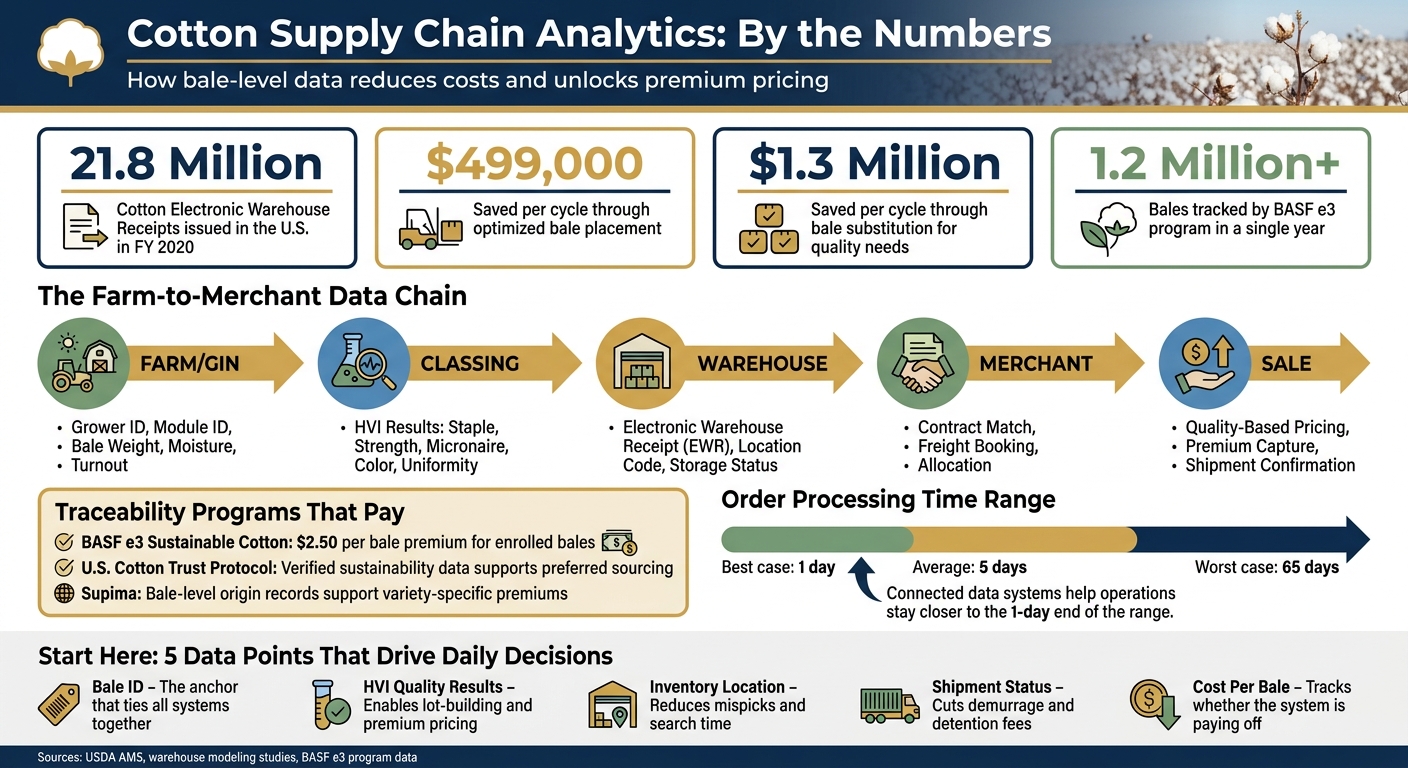
- Speed matters. One study found order processing averaged 5 days, but ranged from 1 to 65 days depending on warehouse pull speed and backlog.
- Quality data drives pricing. HVI results let sellers sort cotton by staple, strength, micronaire, and color instead of selling mixed stock.
- Traceability supports premium programs. Programs like Trust Protocol, Supima, and BASF e3 use bale-level records to support price premiums or preferred sourcing.
- The first data points to connect are simple: bale ID, HVI results, inventory location, shipment status, and cost per bale.
A few numbers stand out:
- 21.8 million cotton electronic warehouse receipts were issued in the U.S. in FY 2020
- Warehouse modeling showed about $499,000 in placement savings per cycle
- Bale substitution to meet quality needs showed about $1.3 million per cycle in savings
- BASF e3 tracked more than 1.2 million bales in one year and paid $2.50 per bale
If I were setting this up, I’d start small: make sure every team uses the same bale ID, send daily inventory updates, match HVI data to each bale, and track shipment status in one place. That alone can cut delays, reduce claims, and help sell cotton by quality instead of by guesswork.
This article explains how that data chain works from the field to the merchant, which systems do the work, and where the margin shows up.
Cotton Supply Chain Analytics: Key Data Points & Financial Impact
TraceBale: Simplifying Textile Supply Chains | CottonConnect
sbb-itb-0e617ca
How the Farm-to-Merchant Data Chain Works
A cotton bale gathers data at each handoff: intake, classing, storage, and shipment. At every step, someone adds a weight, grade, location, or contract record. That shared record lets gin, warehouse, and merchant systems read the same bale the same way. In practice, one record follows the bale from the gin to the classing office, then to the warehouse, and finally to the sale.
Farm and Gin Data: Production Records, Bale ID, and Gin Operations
Data collection starts before the bale is even made. At gin intake, the system logs the grower’s identity, farm and field source, module ID, truck and weight ticket, moisture level, and initial weight. After ginning, the record adds turnout, bale weight, gin date, and gin lot.
The key output at this stage is the Permanent Bale Identification (PBI) number. Every downstream system uses that same PBI instead of trying to match handwritten tags or batch labels. That matters more than it may seem. A shared bale ID cuts confusion and keeps records lined up as the bale moves through the chain.
Gin management systems and ERP platforms pull this data into one operating record. That gives managers a clear view of throughput, cost per bale, and processing exceptions without having to dig through paper logs.
Quality and Inventory Data: HVI Classing, Warehouse Status, and Shipment Visibility
After ginning, bale samples go to a USDA AMS classing office. There, HVI testing measures staple length, strength, micronaire, color, leaf, uniformity, and trash. Those results are stored in the USDA's National Database in Memphis, which covers all AMS classing facilities and is accessible to owners and their agents.
Once HVI results are linked to the PBI, merchants can sort inventory by staple, micronaire, and color. Warehouses then scan the PBI at intake and issue one electronic warehouse receipt for each bale, with its location, receiving weight, and storage status.
In FY 2020, 21.8 million cotton EWRs were issued in the U.S., with each one tied to a single identity-preserved bale. That’s what makes quality-based selling work at scale. When quality data and location data sit under the same bale ID, merchants can allocate bales before freight is even booked.
Merchant and Logistics Data: Contracts, Freight Timing, and Sale Execution
Once cotton is classed and receipted, the merchant’s job becomes pretty simple in theory and much harder in practice: match the right bale to the right contract at the right time.
That takes visibility into a few moving parts:
- Contract shipment windows
- Freight bookings
- Truck or container availability
- Warehouse release dates
- Which bales are already allocated
When those records connect, teams can sequence shipments, cut dwell time, and hit delivery windows. If they don’t, things bog down fast. Warehouse surveys show that delayed gin information is a leading cause of next-day receipting delays.
Disconnected systems also make it harder to confirm what cotton shipped, when it moved, and whether it matched contract terms. That can weaken the seller’s position when there’s a shipment accuracy dispute. For gin, warehouse, and merchant systems, connected records are the backbone of better throughput and tighter shipment timing.
The next step is the software stack that keeps these records moving in real time.
The Core Systems That Turn Cotton Data into Decisions
Four systems carry most of the load in U.S. cotton operations: gin management software, ERP platforms, bale tracking tools, and warehouse dashboards. Together, they turn bale records into faster movement, cleaner inventory, and sharper pricing.
Each system fixes a different problem between bale creation, inventory control, and sale execution. Gin software and ERP platforms help with throughput and cost control. Bale tracking tools and warehouse dashboards tighten location control and order handling. And when quality data ties back to each bale, merchants can sort lots with more precision and sell at the right price.
Gin Management Systems and ERP Platforms for Throughput, Cost, and Bale Records
Gin management systems collect machine-level data such as loads received, bales per hour by line and shift, downtime causes, and energy use. With that live feed, managers can spot trouble early and step in before a small delay turns into a bigger one.
ERP platforms take that production data and place it in a financial view. Cost per bale, labor hours, maintenance spend by equipment group, and grower settlement figures sit in one system. That means lower cost per bale, fewer settlement mistakes, and faster problem spotting without digging through paper logs.
That same financial view also supports the warehouse and merchant systems that manage movement and fulfillment.
Bale Tracking Software and Warehouse Dashboards for Location and Order Accuracy
Barcode or RFID scans follow each bale from press to shipment, building a full movement history. When a warehouse manager opens a dashboard, they can see bales on hand by location, allocation status, and which orders are fully picked and staged for loading.
Good dashboards help teams act fast. They can:
- Flag older lots that should move first to cut storage charges
- Show pick lists matched to truck loading sequences to cut extra handling
- Display on-time departure rates so managers can adjust dock staffing before delays stack up
That movement history cuts mis-picks, missed loads, and extra warehouse handling.
Once bale location is right, quality data starts to shape lot creation and pricing.
Quality-Data Integration with HVI Results for Better Pricing Decisions
When HVI results sit next to bale IDs, merchants can build exact lots, price by quality, and handle claims from one record. That matters in dollar terms. Bales with higher staple and strength can be sold at a premium to mills that pay for consistency, while lower-grade bales can move into markets that fit their quality level.
Integrated bale-level records also shorten claim disputes. If a buyer says the cotton is off spec, both sides can check the same dataset: bale ID, HVI attributes, shipment date, and warehouse handling log, instead of arguing from rough estimates.
In plain terms, quality-linked inventory lets merchants sell cotton by what it is, not as mixed stock. That is what makes premium marketing possible.
Where Analytics Creates Financial Value in Cotton Operations
Once bale, warehouse, and merchant systems use the same records, the payoff tends to show up in two clear areas: lower operating costs and better realized prices.
Reducing Bottlenecks, Handling Costs, and Inventory Mistakes
At peak harvest, small slowdowns can snowball fast. Analytics that tracks arrivals, loading times, and staffing helps cut truck wait times, detention charges, and dock congestion.
Inventory mistakes are expensive too. They lead to rehandling, delays, and claims. In one warehouse model, optimizing bale placement saved about $499,000 per cycle, while substituting bales to meet quality needs produced about $1.3 million per cycle in savings.
The same data that lowers handling costs can also help support premium sales.
Supporting Premiums Through Traceability, Quality Segregation, and Buyer Confidence
Bale-level HVI and origin data gives merchants a way to prove quality and defend price. Programs like the U.S. Cotton Trust Protocol and BASF's e3 Sustainable Cotton program show how this works in practice. The e3 program tracked more than 1.2 million bales in a single year and pays growers a $2.50 per bale premium for every enrolled and ginned bale.
When buyers can see verified quality and origin data, their risk goes down. That can lead to stronger bids and steadier contract terms.
Comparison Table: Cost Savings vs. Premium Revenue Opportunities
| Category | Primary Objective | Key Data Inputs | Core Systems | Metrics That Show Results |
|---|---|---|---|---|
| Cost savings | Lower labor, freight, and storage costs | Timestamps, bale IDs, truck event data, movement logs, labor assignments | Gin ERP, warehouse management, transportation management, yard management | Labor cost per bale, truck wait time, detention fees, error rate, freight cost per pound |
| Premium revenue | Capture stronger bids and access premium programs | HVI results, farm/grower IDs, certification status, buyer program requirements | Classing databases, traceability platforms, ERP, merchant contract management | Price uplift (cents per pound), % of crop sold into premium programs, discount reductions, claim frequency |
That sets up the next step: deciding which data points to connect first across gin, warehouse, and merchant workflows.
How to Build a Practical Cotton Analytics Setup
Start with the Data That Changes Daily Actions First
Once the core systems are in place, the next move is deciding what data to connect first. Keep it simple and start with five fields: bale ID, HVI quality results, inventory location, shipment status, and basic cost per bale. These are the numbers and labels that shape day-to-day choices at the gin, warehouse, and merchant desk.
Bale ID is the anchor. One identifier that follows the bale from gin to merchant helps cut misallocations and claims. Add HVI data, and you can build lots that match contract specs with more precision, which helps reduce discounts and improve premium capture.
Then bring in inventory location codes like row, stack, bay, or zone. That makes bales easier to find, cuts search time, and lowers the odds of mispicks. Shipment status helps keep freight coordination on track, which can reduce demurrage and detention. And basic cost tracking matters more than it may seem. Even a simple view of ginning cost per bale or storage cost per month gives you a way to see whether the setup is paying off.
Connect Systems Across Gin, Warehouse, and Merchant Workflows
After you define the priority data, connect it across gin, warehouse, and merchant workflows. Start with the first fix: a shared bale ID and a scheduled data exchange.
Standardize bale IDs first. Then set a routine for moving classing, inventory, and shipment data between teams:
- Gins send classed bale lists
- Warehouses share daily inventory snapshots
- Merchants return allocation and shipment instructions
At first, these exchanges can be manual. Later, they can shift to API connections for near-real-time updates.
Conclusion: Better Data Use Leads to Faster Decisions and Stronger Margins
Connected bale-level data cuts delays, reduces errors, and supports stronger pricing. That is where cotton analytics turns into margin.
FAQs
How does one bale ID reduce delays?
A bale ID, or Permanent Bale Identification (PBI), helps cut delays by giving each bale its own digital ID. That makes real-time tracking possible from the gin to the warehouse.
It also ties each bale to fiber quality data in the USDA national database. The payoff is pretty clear: less manual data entry, fewer mistakes, faster buyer checks, and quicker bale lookup in warehouses so shipping doesn't get jammed up.
What systems should I connect first?
Start with a digital inventory management system that assigns unique bale identification through Permanent Bale Identification (PBI) tags.
From there, pull that data into one central platform that connects farm registrations, module tracking, and USDA classing results. That gives your team one place to follow each bale instead of bouncing between systems.
The next step is to connect your inventory software with your gin’s internal records and third-party accounting systems. This cuts down on duplicate entry and helps automate the flow of quality data, so your records stay cleaner and your staff spends less time keying in the same information twice.
How does HVI data increase cotton premiums?
HVI data can increase cotton premiums because it gives buyers a standard, objective way to judge fiber quality. It measures key traits like length, strength, uniformity, micronaire, color, and trash content. That makes it easier for buyers to match cotton with their mill or product needs with more confidence and clearer expectations.
When HVI is tied into inventory management software, those test results do more than sit in a report. Producers and merchants can use them to calculate premiums and discounts, spot higher-quality lots, and market certified cotton in a clearer, more persuasive way.