If you still irrigate cotton by habit or by sight, you’re likely spending too much and reacting too late.
I see the main point like this: sensor data helps you decide when to water, when to stop, where to scout, and which fields need attention first. That matters when cotton covers 10.2 million acres and one extra 1 inch of water across 1,000 acres can cost $7,000 to $11,000.
Here’s the short version:
- Soil moisture probes show what’s happening in the root zone.
- Canopy temperature sensors flag crop stress before wilt shows up.
- Weather stations track ET, rainfall, heat, humidity, and wind.
- Microclimate sensors and imaging tools help target scouting for pest, disease, and uneven growth.
- Dashboards and alerts turn readings into daily field actions.
- The same records can help with harvest timing and gin planning.
What this article says in plain English:
- Fixed irrigation schedules can apply 15% to 30% more water than cotton needs.
- Visible stress is often a late warning.
- Multi-depth probes help you decide when to start irrigation and when to shut it off.
- Canopy temperature running 3°F to 6°F above air temperature can point to water stress.
- Peak cotton ET can reach 0.25 to 0.35 inch per day in hot, dry weather.
- Sensor-guided irrigation has been tied to $35 per acre more profit in the article’s cited research.
- In one case, tighter irrigation sets saved 2 to 4 inches of water over a season.
- Sensor records can also support yield forecasts and help you line up gin deliveries earlier.
A simple way to think about it: soil data tells you what the roots have, plant data shows stress, and weather data helps time the next move. The rest of the article explains how those pieces fit together on a cotton farm.
How Sensors Improve Irrigation Decisions in Cotton Fields
Smart Sensors for Cotton Farming: Types, Costs & Key Benefits
Irrigation is often the first place where sensor data earns its keep. Instead of watering on a fixed schedule, you can make each call based on root-zone moisture and plant stress. That change cuts wasted water and makes each irrigation pass more precise. At the most basic level, sensors answer one question: does the root zone need water right now?
Soil Moisture Probes: Knowing When Water Is Actually Needed
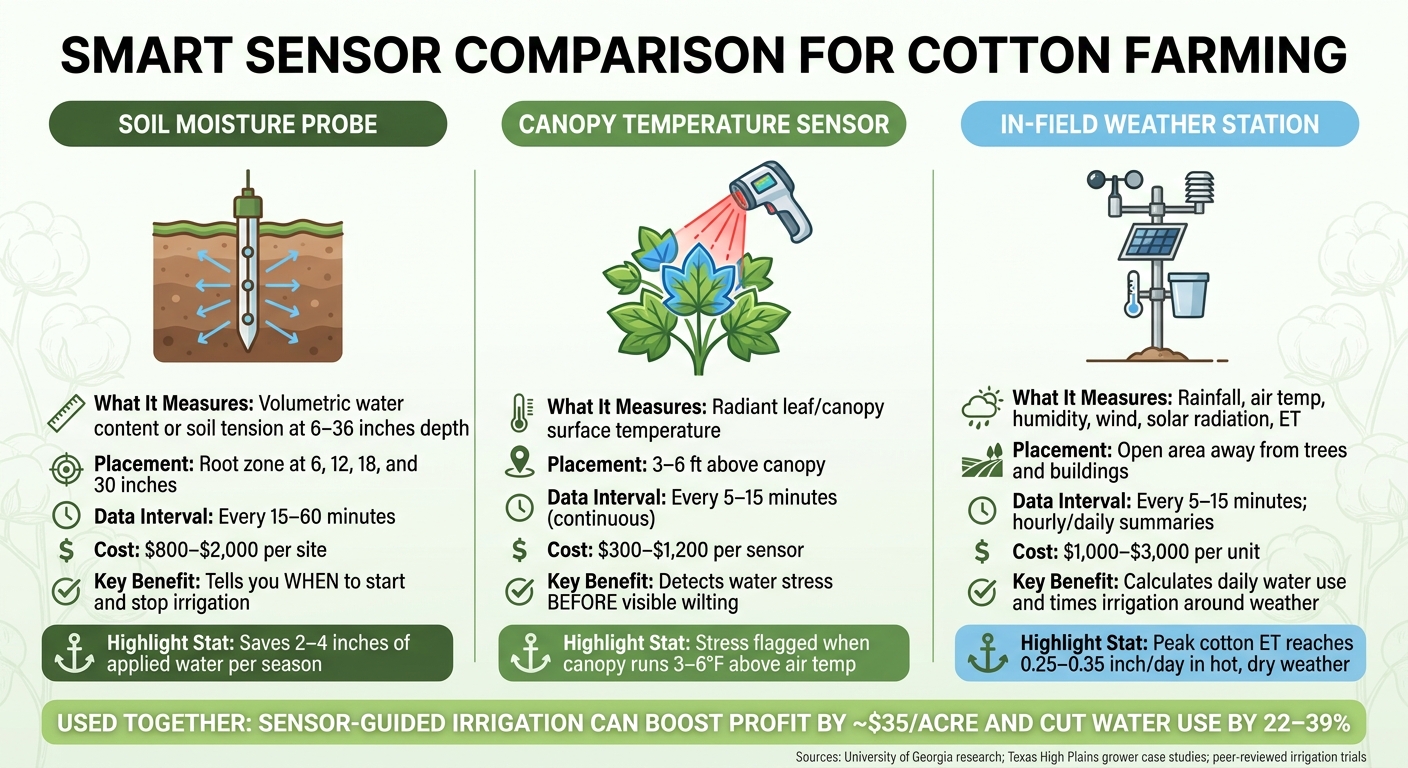
Multi-depth soil moisture probes are the starting point for sensor-based irrigation. In cotton, a practical setup puts sensors at 6, 12, 18, and 30 inches. That lets you track the active root zone and watch how water moves through the soil profile. Most systems log data every 15–60 minutes and sync it to a web dashboard or app, so you can see what happened overnight instead of guessing.
The main threshold to watch is management allowable depletion (MAD), which is usually 30–50% of the soil's available water holding capacity. Once the upper 18–24 inches of the root zone gets close to that point, irrigation should begin. University of Georgia work with wireless Watermark™ sensors at 8, 16, and 24 inches found that 40 kPa soil water tension in the weighted root zone is a solid irrigation trigger for cotton.
Probes also help with the other half of the job: knowing when to quit. If moisture is moving into the lower root zone but not stopping within 30–36 inches, it's a sign to stop before water and fertilizer slip below the roots. One grower in the Texas High Plains switched to 0.6–0.8-inch sets based on probe readings and found that earlier applications had been pushing water past 30 inches. That change saved 2–4 inches of applied water over the season.
Soil data tells you what's available belowground. Canopy temperature shows whether the plant is already starting to feel the strain.
Canopy Temperature Sensors and Weather Stations: Confirming Crop Stress
Infrared sensors track leaf surface temperature through the day. When cotton is transpiring well, canopy temperature tends to stay near air temperature or a bit below it. When water stress kicks in, stomata close, transpiration drops, and canopy temperature can run 3–6°F above air temperature. That can happen hours before you see wilting with the naked eye.
Some setups calculate a Crop Water Stress Index (CWSI). This metric blends canopy temperature, air temperature, relative humidity, and solar radiation into a 0–1 scale. If CWSI climbs during a hot afternoon and soil probes also show root-zone depletion, you have two separate signals pointing to the same move: irrigate now.
In-field weather stations add another layer by tracking rainfall, humidity, wind speed, solar radiation, and evapotranspiration (ET) at the field itself. During peak cotton water use, ET can reach 0.25–0.35 inch per day in hot, dry weather. Paired with days since the last rain and current soil moisture, that helps you judge how much to apply on the next pivot pass, whether that's 0.5, 0.75, or 1.0 inch. And when a cool front cuts ET for a few days, you can stretch the irrigation interval and skip an extra pump run.
| Sensor Type | What It Measures | Placement | Data Interval | Main Decision Supported | Approx. U.S. Cost | Key Strengths / Limits |
|---|---|---|---|---|---|---|
| Soil Moisture Probe (multi-depth capacitance or TDR) | Volumetric water content or soil tension at 6–36 in. | Root zone, representative soil zone | Every 15–60 min | When to start/stop irrigation; detect deep percolation | $800–$2,000/site | Precise root-zone visibility; limited spatial coverage per site |
| Canopy Temperature Sensor (infrared) | Radiant leaf/canopy surface temperature | 3–6 ft above canopy, aimed at representative rows | Continuous or every 5–15 min | Detect plant water stress before visible wilting; confirm stress vs. heat spike | $300–$1,200/sensor | Early stress detection; sensitive to placement and background interference |
| In-Field Weather Station | Rainfall, air temp, humidity, wind, solar radiation, ET | Open area, away from trees and buildings | Every 5–15 min; hourly/daily summaries | Calculate daily water use; track rainfall; time irrigation around weather | $1,000–$3,000/unit | Broad planning support; does not measure root-zone moisture or plant stress directly |
Used together, these three tools work as one irrigation setup. Soil moisture tells you when to start. Canopy temperature checks whether the crop is under stress. Weather data fine-tunes timing and application depth. A simple flow works well: look at ET and rainfall, compare that with soil probe trends, then check canopy temperature. When irrigation is dialed in, the same data can also help you tell water stress apart from fertility issues and pest pressure.
sbb-itb-0e617ca
Using Sensor Data to Manage Fertility, Plant Health, and Pest Risk
Once irrigation is dialed in, the same sensor data can help explain uneven growth and a jump in pest pressure. In other words, the readings you're already using for water decisions can also show why one part of a field is thriving while another is falling behind.
How Soil and Canopy Data Explain Uneven Growth Across a Field
Uneven cotton stands are easy to notice from the road. Figuring out the cause is the hard part.
A thin or yellow zone might be dealing with too much water, soil compaction, low nitrogen, or long-term drought stress. And each issue calls for a different fix. That’s where soil moisture probes at multiple depths earn their keep. They help sort out the cause fast. A wet area will usually show high readings after rain, slow drainage, and weak uptake deeper in the profile. A compacted zone often shows moisture rising fast after rainfall, then dropping slowly, with little sign that roots are pulling water below the shallow layers. Depth-by-depth probes can map root depth, water-holding capacity, and stress timing.
Canopy data adds another layer. Midday canopy temperatures that run several degrees hotter than well-watered plants point to stress before you can see wilting. If one zone keeps running hotter at midday, that’s your cue to pull soil and tissue samples. The root zone may be too dry, too shallow, or short on nutrients. NDVI maps can also flag low-vigor zones early, so you can target tissue sampling or fertility changes before yield starts to slip.
Place probes in heavier soil zones where water-holding capacity is higher, so your prescriptions line up with how the field actually behaves.
Once those weak spots are mapped, microclimate data can show whether the same areas also carry more disease or pest risk.
Microclimate Sensors and Faster Pest and Disease Response
Microclimate sensors track air temperature, relative humidity, leaf wetness, and wind near the canopy. That gives you an early look at conditions that favor disease and pest pressure. Fungal diseases such as Alternaria leaf spot and boll rot tend to develop in warm, humid conditions with long periods of leaf wetness. If leaf wetness hangs on through warm nights, scout those zones first. For insects like aphids, whiteflies, and bollworms, a warm microclimate often points to fast population growth. Degree days can then help time scouting around peak pest emergence.
These tools are often used with cameras and AI to spot problems earlier than visual scouting. They work best as a group, but each one answers a different question.
| Tool Type | Primary Problem Detected | Deployment Location | How Data Are Used | Practical Constraints |
|---|---|---|---|---|
| Microclimate sensors (temp, humidity, leaf wetness, wind) | Disease-favorable conditions (e.g., boll rot, Alternaria); pest pressure tied to temp/humidity patterns | Mounted at or just above canopy height in representative zones | Calculate disease risk periods, degree days for insect development; trigger scouting alerts | Sensitive to placement; need shielding from direct sun and rain; may need multiple units across variable terrain |
| Soil sensors (moisture, temperature, EC) | Root-zone stress (too wet, too dry, too cold), compaction-related waterlogging, nutrient uptake limits | Installed at multiple depths (e.g., 6, 12, 18 in.) in representative field zones | Guide irrigation scheduling; identify problem zones for variable-rate fertility and drainage/tillage decisions | Require installation and maintenance; readings are point-specific and may miss small-scale variability; probes can be damaged by field operations |
| Imaging / camera-based tools (drone, satellite, tractor-mounted) | Uneven canopy vigor, early stress signatures, visible pest or disease symptoms | Flown over fields via drone or satellite; fixed cameras on pivots or implements | Provide spatial NDVI or RGB maps to identify zones for follow-up soil and canopy sensor validation | Weather-dependent; variable revisit frequency; require data processing expertise; don't capture root-zone conditions directly |
When sensor data point to a high-risk window, you can send scouts to the right zones first and avoid spray passes when field conditions don’t support them.
Turning Sensor Readings Into Daily Management Actions
Raw sensor data won’t manage a cotton crop on its own. Alerts do. The next step is turning those signals into a field plan your team can use every day.
At a glance, every platform should answer one question: Which field needs attention today? A decision platform can pull together weather, soil conditions, crop stage, and irrigation history to flag root-zone deficits and rainfall in real time. Simple probe dashboards are a good fit for smaller operations that are moving away from calendar-based scheduling. Integrated irrigation interfaces make more sense for larger pivot systems. And multi-sensor mobile platforms work well for multi-farm operations that have agronomy support.
A simple weekly routine keeps the data useful:
- Review alerts on Monday
- Scout flagged zones midweek
- Reset thresholds after Friday’s field notes
That kind of rhythm keeps sensor data from turning into noise.
The day-to-day payoff can show up fast. 75% deficit irrigation held seed cotton yield while cutting irrigation use by 22% to 39%. Sensor-based irrigation also raised profits by about $35 per acre. Instead of sending crews through every field on a fixed rotation, a ranked alert list sends irrigators first to the fields where sensors show actual root-zone depletion.
That shift matters in practice. Consultants using dashboard snapshots shared by smartphone have directed field managers to specific pivot ends or problem blocks without needing an on-site visit for every call. Sensor records also make skipped irrigations easier to defend. After a rain, growers can check moisture levels, confirm that the profile is still in good shape, and avoid another pump run they don’t need. The same records can also help line up harvest timing and gin logistics.
Conclusion: Sensor-Driven Cotton Management and Better Coordination With Gins
When sensor data shape in-season decisions, those same records can also help with harvest timing and gin delivery.
Smart sensors give cotton growers something a calendar never could: a clear, real-time view of what’s happening in the field. That changes how decisions get made. Instead of treating every acre the same on a fixed schedule, field managers can use field readings to make faster calls on irrigation, scouting, and pest pressure - and focus on the acres that need attention first.
That payoff carries into harvest. In-season sensor data and vegetation indices can sharpen yield forecasts, making it easier to plan gin delivery timing and cut down on surprises tied to fiber quality and bale moisture at ginning.
Use cottongins.org to compare gin capacity, line up delivery windows, and share harvest forecasts before harvest begins.
Key takeaways for growers considering sensors:
- Start with soil moisture probes in representative fields, then add canopy temperature and weather data as needed.
- Use in-season data to build a harvest forecast and share it with your gin contact early.
Set clear thresholds, add tools only when they reduce real uncertainty, and use the same records to support both field decisions and harvest logistics.
FAQs
How many sensors do I need to start?
You don’t need a massive setup. It’s usually smarter to start small so you can keep costs in check and avoid drowning in too much data.
Begin with one field and 2 to 3 sensors. That gives you a simple way to learn the system before you scale. For farms under 100 acres, a basic setup with soil moisture probes and simple irrigation controllers is a practical place to start.
From there, you can add more based on field size, irrigation zones, and proven return on investment.
Which fields should get sensors first?
Start with the fields where better data can change day-to-day decisions fast. That matters most when water is tight, soils shift across the field, or irrigation mistakes get expensive in a hurry. Think sandy ground right next to heavier clay. One part dries out fast, while the other holds water longer. Treating both areas the same is where trouble starts.
Soil moisture probes are a smart place to begin. Put them in distinct management zones instead of dropping one probe in a single “average” field location. That way, the data lines up with what’s actually happening across differences in soil, slope, and yield history.
After the first season, review what the readings showed and then add more coverage where it makes sense.
How long does it take to see a return?
Growers can usually expect to see a return on investment within 2 to 3 years as lower input costs and stronger yields start to stack up.
The money side tends to build over several seasons, but the day-to-day gains show up right away. When growers spot crop stress before visible wilting starts, they have more time to act. That helps protect yield potential and can improve performance by about $20 to $61 per acre through better irrigation timing and less pump runtime.