If I had to cut this guide down to one line, it would be this: start with the problem that costs you the most money, then test one tool for one season.
In cotton, the first wins usually come from better irrigation timing, less input waste, fewer machine delays, and cleaner field-to-bale records. The article makes that clear with a few numbers: sensor-guided irrigation lifted net income by $202.28 per acre in one Clemson study, and another USDA-ARS example showed up to 50% less water use with 10%–15% higher lint yield under app-based irrigation scheduling.
Here’s the short version of what matters most:
- Dryland farms should look first at weather data, satellite imagery, and farm software.
- Irrigated farms should start with soil moisture sensors and irrigation control.
- Medium and large farms often get early payback from telematics, guidance, section control, and shared software.
- Gins and integrated cotton businesses should focus on bale records, module tracking, and data flow between field and gin.
- The best rollout path is simple: one field, one problem, one season, one metric.
A few tools stand out in the article:
- Soil moisture sensors help time irrigation, with common triggers around 50–60 centibars.
- Drones and satellites help with stand checks, stress spots, pest scouting, and harvest timing.
- Variable-rate systems cut overlap and trim fertilizer or crop protection use by zone.
- Pivot VRI and connected drip improve water placement and fertigation control.
- Telematics track machines, modules, picker progress, and downtime.
- Farm management software and AI scouting turn field records into actions and support bale traceability.
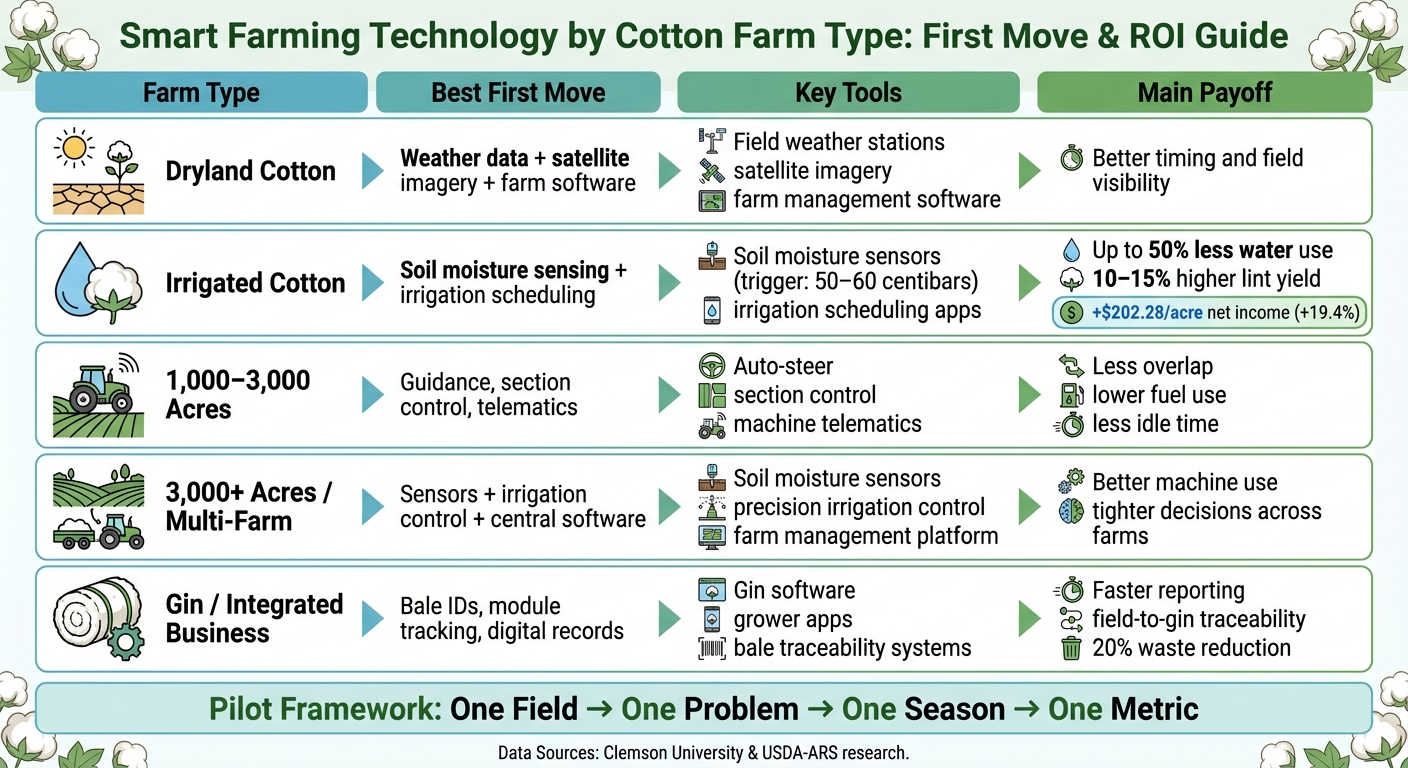
Smart Farming Technology by Cotton Farm Type: ROI & First Move Guide
Quick comparison
| Farm type | Best first move | Main payoff |
|---|---|---|
| Dryland cotton | Weather data + satellite imagery + software | Better timing and field visibility |
| Irrigated cotton | Soil moisture sensing + irrigation scheduling | Lower water use, lower pumping cost, steadier yield |
| 1,000–3,000 acres | Guidance, section control, telematics | Less overlap, lower fuel use, less idle time |
| 3,000+ acres / multi-farm | Sensors + irrigation control + central software | Better machine use, tighter decisions across farms |
| Gin / integrated business | Bale IDs, module tracking, digital records | Faster reporting and field-to-gin traceability |
What I like about this article is that it does not treat smart farming as one big system you have to buy all at once. It breaks the topic into plain categories - sensing, automation, and data tools - and shows where each one fits from planting through harvest and ginning. That makes it easier to decide what to test first instead of piling on too much at once.
sbb-itb-0e617ca
The Technology Groups That Matter Most in Cotton
Cotton smart tech falls into three main groups: sensing, automation, and data/AI. Sensing shows what’s happening in the field. Automation responds to those conditions. Software takes the records and helps turn them into field decisions.
Sensing Tools: Soil Moisture Sensors, Weather Stations, Drones, and Satellite Imagery
In irrigated cotton, sensing tools are the most direct way to time water and spot stress early. They help with irrigation timing, stress detection, stand checks, and defoliation timing.
Soil moisture sensors matter most in irrigated cotton because they show when the root zone is drying out. A common irrigation trigger is 50–60 centibars, with adjustments based on soil type and rooting depth.
Field weather stations add local temperature, humidity, wind, and rainfall data. That gives growers a better read on rain totals, spray timing, and irrigation scheduling.
Drones provide high-resolution images that help with stand checks, stress mapping, and defoliation timing. Satellite imagery covers more acres in one shot, which makes it useful for whole-field crop monitoring.
| Tool | Primary Cotton Use | Best Fit |
|---|---|---|
| Soil moisture sensors | Irrigation trigger, root zone monitoring | Irrigated fields that need tighter water control |
| Weather stations | Local temperature, humidity, wind, and rainfall tracking | Any operation that needs field-level weather data |
| Drones | Stand assessment, stress mapping, defoliation checks | Targeted problem areas |
| Satellite imagery | Broad field coverage for crop-health monitoring | Broad field monitoring |
These tools feed the automation systems below.
Automation Tools: Variable-Rate Application, Irrigation Control, and Machine Telematics
Once data comes in, automation puts it to work. In cotton, the three biggest tools are variable-rate application systems, irrigation automation, and machine telematics. Together, they help with water application, nitrogen use, crop protection, and harvest logistics.
Variable-rate systems use zone data or imagery to change fertilizer and crop-protection rates across a field. In cotton, sensor-guided variable-rate nitrogen has produced strong returns and cut total nitrogen use without reducing yield.
In cotton, irrigation automation often means VRI pivots that adjust water depth by zone during a single pass. When paired with soil moisture sensors and remote sensing, these systems schedule irrigation based on crop need and soil conditions. Connected drip systems can also manage water and fertigation from one platform.
Machine telematics track machine location, module location, harvest progress, and downtime. When tied to gin records, they also support bale traceability.
| Tool | What It Controls | ROI Driver |
|---|---|---|
| Variable-rate application | Fertilizer and crop protection rates by zone | Input savings + yield improvement |
| Irrigation automation (pivot VRI) | Water volume by zone, irrigation scheduling | Water savings, yield consistency |
| Connected drip + fertigation | Water and nutrient delivery per zone | Water efficiency, input precision |
| Machine telematics | Machine and module location, harvest progress | Uptime, harvest logistics, traceability |
The next step is software that pulls all this data together and points out what needs attention.
Data and AI Tools: Pest Scouting, Farm Management Software, and Decision Support
After sensing and automation, software keeps scouting, sensor, and machine records searchable and usable. It turns field data into decisions by organizing those records in one place. In cotton, the main payoff is faster pest response, cleaner records, and bale-level visibility.
AI on drone imagery can map pests and flag outbreaks faster than manual scouting. That supports more targeted responses and can cut unnecessary applications.
Farm management software brings field records, sensor data, and machine logs into one system. For traceability programs, it can also connect field records to bale IDs.
| Workflow | Labor Demand | Data Quality | Decision Speed |
|---|---|---|---|
| Manual scouting and paper logs | High | Inconsistent, hard to retrieve | Slow; relies on individual recall |
| Software-assisted (digital records) | Moderate | Consistent and searchable | Faster; data available across the team |
| AI-supported (automated imagery + decision tools) | Low | High; standardized and timestamped | Fast; flags issues before they spread |
Where Each Technology Fits in the Cotton Production Cycle
Smart tools work best when they line up with the decision in front of you. In cotton, timing is a big deal. You plan before planting, watch for stress in the middle of the season, and use field data to help time harvest.
Pre-Plant to Early Season: Stand Establishment, Soil Conditions, and Input Planning
Before the first seed goes in the ground, weather stations and ET models help you pick planting windows and start irrigation planning. Add updated field maps - soil type, past yield, and elevation - inside farm management software, and you can build variable-rate fertilizer and herbicide prescriptions before planting instead of reacting later.
Early in the season, remote sensing helps you check stand establishment and spot field variability, which matters a lot on medium and large farms where walking every acre just isn't practical. A drone flight 3–7 days after emergence can flag underpopulated rows and drowned-out zones. From there, you can turn those spots into GPS scouting tasks so scouts can verify the issue and upload photos from the field.
Over time, those mapped emergence patterns do more than help with this year's stand check. They also give you a base for variable-rate seeding and fertility prescriptions in future seasons. As emergence starts, the job shifts from planning to stand checks, and those stand maps become the baseline for in-season scouting.
Mid-Season: Irrigation Timing, Stress Detection, and Pest Pressure Response
Soil moisture sensors cut a lot of the guesswork from irrigation timing. Clemson University research found that sensor-guided irrigation can increase average net income by almost 20%, mostly from more efficient water use and lower pumping costs.
Satellite and drone imagery add another layer. They can spot stress before you can see it from the ground. In cotton, that may point to nutrient deficiencies, water stress, or disease pressure. Remote sensing can also help scouts focus pest checks in the parts of the field where pressure is building. The same field data also helps set up defoliation decisions later in the season.
Late Season to Harvest: Defoliation Timing, Harvest Logistics, and Field-to-Gin Visibility
Late in the season, digital tools make defoliation decisions more tied to field conditions and less tied to the calendar or a few visual checks. Weather data and forecasts track the conditions that shape defoliant performance, including temperature, humidity, wind, and rainfall. If rain or high humidity is on the way, growers can schedule defoliant applications around those conditions to avoid weaker results or leaves hanging on the crop.
Drone or satellite imagery also shows boll opening and leaf senescence patterns across the field, which helps sort out which blocks are ready now and which need more time.
At harvest, telematics, yield maps, and farm management software track picker progress, module movement, and downtime so trucks and gins stay in sync. At that stage, harvest data shifts straight into gin logistics.
Cost, ROI, and Adoption Priorities for Different Cotton Operations
Judge each tool by two things: how much money it can save and how fast it pays for itself. In cotton, the biggest cost levers are usually water, fuel, labor, and input overlap. So the goal isn't to buy what's new. It's to buy what improves timing, input efficiency, or field-to-bale visibility.
This section is about ranking tools by payback, not by hype.
What to Buy First on Small, Medium, and Large Cotton Farms
Farm size changes the math. The best first purchase is usually the one that removes the most expensive constraint.
For small cotton farms under 1,000 acres, start with soil moisture sensors on irrigated ground or a moisture-based irrigation scheduling service. That move can pay fast. In Clemson University research across six irrigated farms, sensor-guided irrigation increased average net income by $202.28 per acre, a 19.4% gain. On a smaller acreage base, that kind of first-season return stands out.
For medium-sized operations, 1,000–3,000 acres, the next buys are often auto-steer, section control, and precision irrigation scheduling on fields where overlap and water use drive cost. At this size, telematics starts to earn its keep too. It helps track machine hours, idle time, and service intervals across several machines.
For large operations, 3,000+ acres or multi-farm enterprises, the strongest ROI often comes from pairing soil moisture sensors with precision irrigation control. From there, it makes sense to connect that data with pest alerts and harvest logistics inside one farm management system. Telematics and machine monitoring also tend to pay at this scale by cutting idle time, improving routes, and keeping service intervals on track across a bigger fleet.
Once the first tool proves it can save money, move to the next bottleneck. Not before.
How Water Limits, Labor Pressure, and Region Change the Best Choice
Local pressure changes the priority list.
In water-limited regions like parts of the Texas High Plains, sensors, scheduling, and variable-rate irrigation should be near the top. USDA-ARS research on the IrrigatorPro cotton irrigation app found up to a 50% reduction in water use and a 10%–15% improvement in lint yield compared with conventional irrigation schedules.
In more water-abundant but energy- or labor-constrained regions like parts of the Delta, guidance, section control, and variable-rate technology may come first. These tools can cut fuel, fertilizer, and herbicide use while improving nutrient and pest management.
How to Run a Pilot Before a Full Rollout
Start with one tight pilot before rolling anything out across the farm. That keeps risk down and makes the result easier to read.
- One field: Pick a field that reflects a clear problem, like likely over-irrigation, repeated pest pressure, or uneven yields.
- One problem: Set one main goal, such as fewer irrigation passes, lower pesticide use, or less overlap.
- One season: Use the tool the same way for a full season so weather and pest swings are part of the test.
- One success metric: Track one measurable cotton metric, such as gallons of water pumped per acre, number of irrigations, pounds of lint per acre, herbicide or pesticide cost per acre, or diesel use per acre.
Record baseline performance before the pilot starts. One season of before-and-after data is enough to decide whether the tool should scale.
If the pilot pays, move that data into the gin and logistics workflow in the next section.
Cotton Gin Integration and a 2026 Adoption Roadmap
Smart Tools for Cotton Gins: Bale Data, Logistics, and Automation
After harvest starts, the next lift comes from tying field choices to gin records. Smart farming only pays off if the gin can collect the right data and send it back in a usable way. In 2026, the strongest cotton operations connect field decisions to gin records so bale quality, moisture, and turnout can shape the next season.
Gin software and grower apps can tie bale ID, moisture, weight, classing, and delivery time into a single record. That means less manual entry and faster reporting. They can also collect bale and module data right where the work happens. That matters because bale data only helps when it's entered once and shared cleanly.
The table below shows where manual and digital gin workflows split the most.
| Workflow Area | Manual | Digitized |
|---|---|---|
| Traceability | Paper tickets, reconciled later | Bale-level records linked to field, variety, and harvest date |
| Labor demands | High - data entry, phone calls, manual reconciliation | Lower - point-of-activity capture, automated reporting |
| Error risk | Transcription errors, lost tickets | Reduced - data captured at source |
| Reporting speed | Hours to days after ginning | Near real-time |
| Grower visibility | Limited until paperwork is processed | Immediate access via app or portal |
For gins dealing with tight staffing, conveyor controls, moisture monitoring, and remote diagnostics tend to pay back first. A reported AI automation project in cotton processing improved the accuracy of cotton separation and cut waste by 20% while also reducing manual intervention. In plain terms, it's usually smarter to start with digital quality records and inventory before moving to full-line automation.
Using cottongins.org to Support Local Adoption Planning
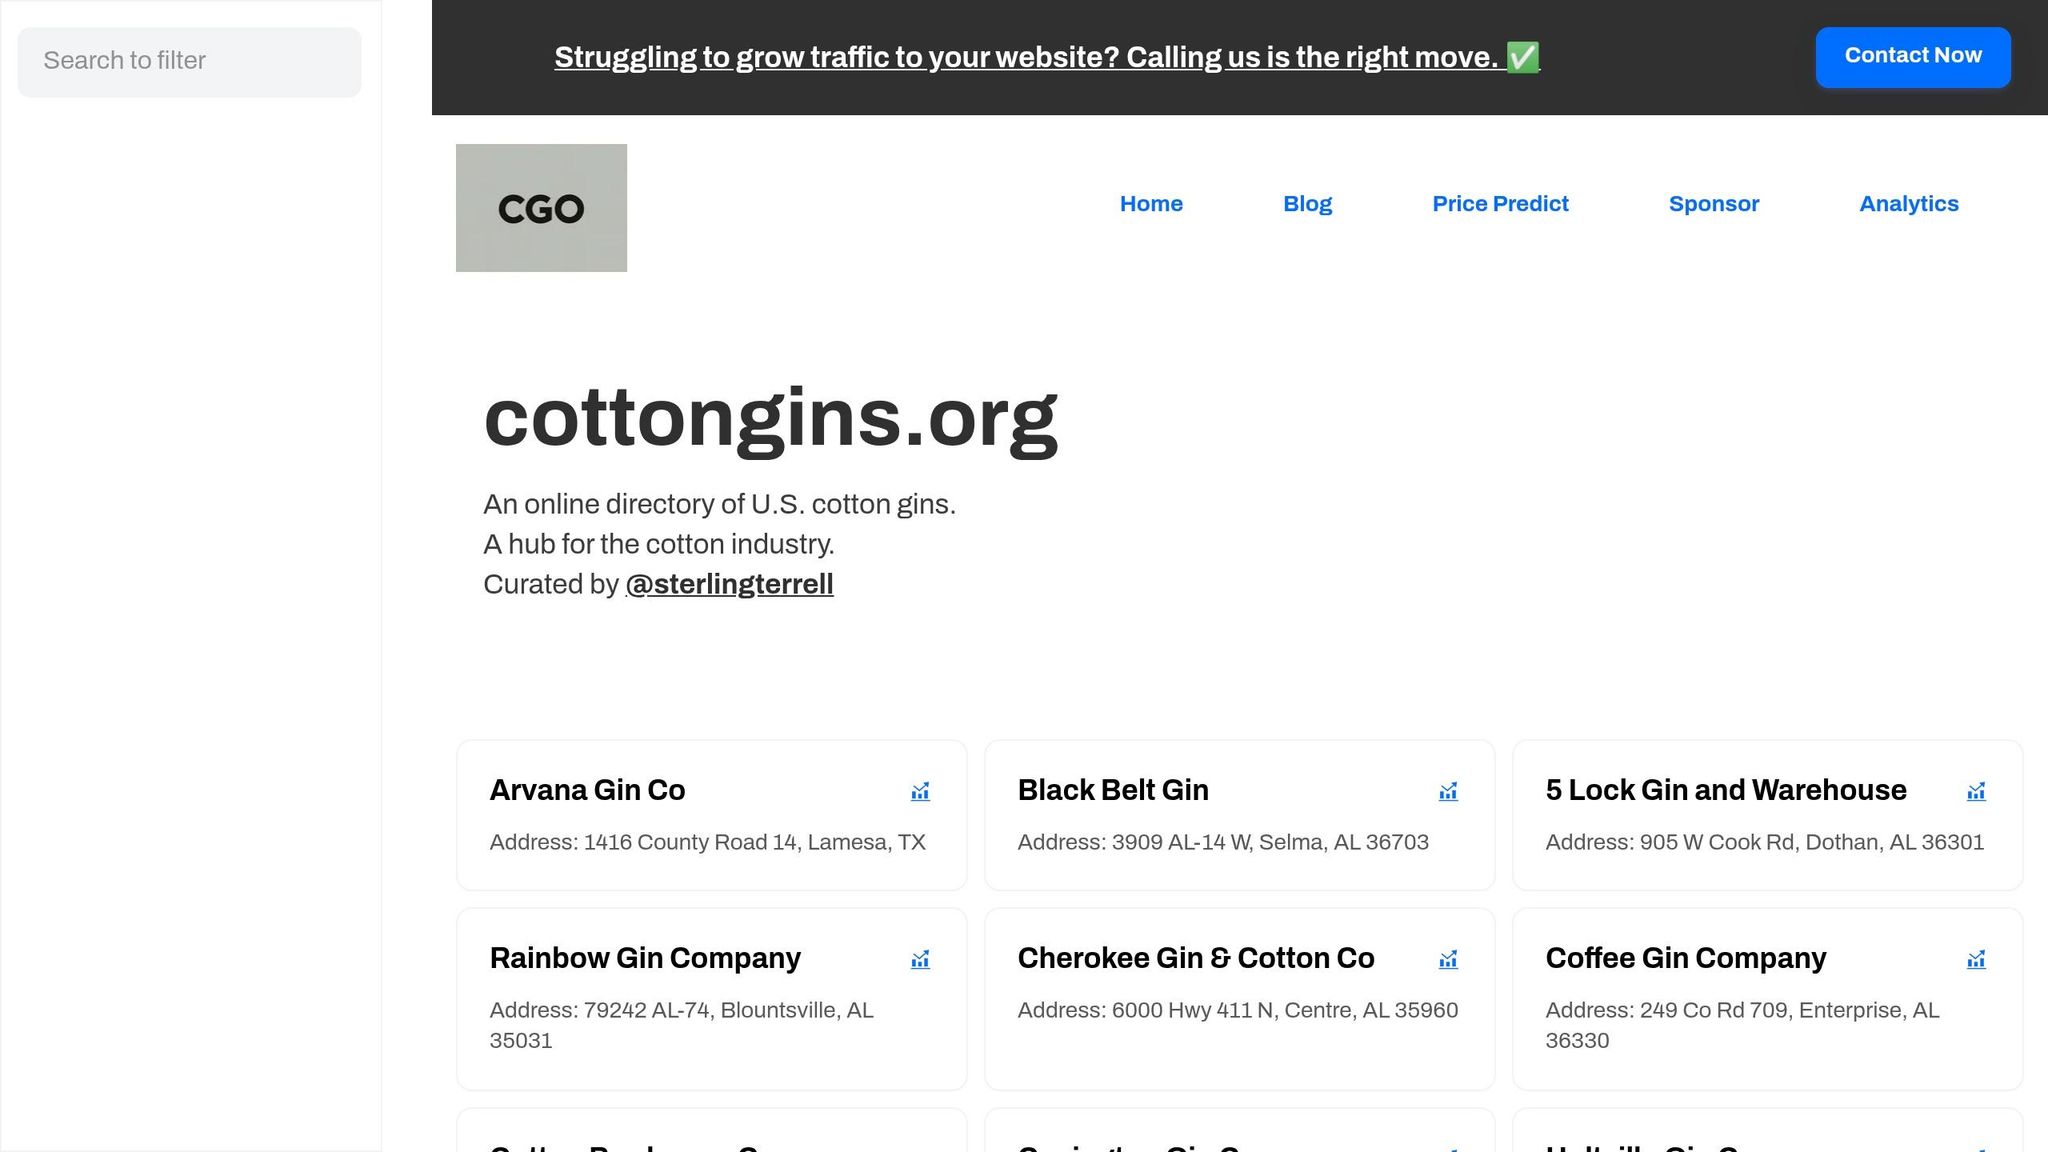
Before you buy new gin-connected tools, map the gins you already work with and check what data they can accept. Set those gin relationships before modules hit the yard. cottongins.org is a U.S. cotton gin directory that helps growers and industry operators find nearby gin locations by county and state. It's a practical place to start when you're lining up harvest logistics and record exchange. If a nearby gin already uses digital quality records or grower-facing apps, that gives you a clear signal about which data workflow to match.
Conclusion: Start With One Problem, Then Build Your 2026 Tech Stack
The rollout path is pretty simple. Start with the bottleneck that limits water, labor, or traceability. Pilot one tool for one season, measure one metric, then scale only if the result holds.
FAQs
How much should I budget to start?
Plan to spend $5,000 to $20,000 for entry-level smart farming tools. A lot of growers begin with retrofit kits or focused tools, like drone imagery for scouting or soil moisture sensors, to cut waste first.
If variable-rate technology is the main goal, expect costs in the $10,000 to $20,000 range. One smart way to keep spending under control is to start with a single field or about 10% of your acreage, then scale up after two to three seasons of ROI tracking.
Which smart farming tool fits my farm first?
Start by pinpointing where you're losing the most money, time, or inputs. That's the best place to begin.
The smart move is to add tech step by step, not all at once. For most farms, GPS guidance systems like auto-steer or swath control make the best first move. They can cut overlap and reduce waste without making daily work much harder.
After that, bring in soil and yield mapping to set up management zones. Then look at tools like soil moisture sensors or basic drone scouting. Save more advanced systems, such as variable-rate technology, for later once you have the data and workflow to support them.
How do I measure ROI after one season?
Measure ROI by comparing input savings and yield gains from the technology over one season. A simple way to do that is to use harvest yield maps and compare VRT-applied strips against uniform-management strips.
Then pull your software records and calculate the drop in cost per bale, often $20.00 to $40.00. Include input savings too, such as 15% to 20% less fertilizer and irrigation. Use that first-season data to fine-tune next year’s prescriptions.