If I can spot cotton stress 1 to 2 weeks before I see wilting, I may recover 70% to 90% of the yield loss that would otherwise hit the field. That is the main reason I use satellite imagery: it helps me find the right acres to scout first, before heat, water stress, insects, disease, or stand issues cut yield and fiber quality.
Here’s the short version:
- Satellite maps show where stress is building, not the exact cause
- Thermal imagery helps me find water stress and irrigation problems before leaves wilt
- NDVI shows crop vigor and weak zones
- NDRE helps me check chlorophyll, nitrogen stress, and canopy changes
- MSAVI helps early in the season when bare soil still shows
- Sentinel-2 gives me field-scale views every 5 days at 10–20 m resolution
- Landsat is better for longer-term field trends at 30 m resolution
- I still need to walk the field, sample tissue or soil, and confirm the cause before I irrigate, spray, or spread fertilizer
A few numbers stand out:
- Cotton stress can start with hotter canopies within hours to days
- Visible wilting may take 2 to 4 weeks
- If I wait until wilting is easy to see, recovery may drop to 30% to 50%
- Early action may improve returns by about $20 to $61 per acre
Satellite imagery also helps me sort through common cotton problems:
- drought stress
- irrigation gaps
- nutrient shortages
- salinity
- insect pressure
- disease spread
- uneven stand
- compaction
- storm damage and lodging
PRECISION AG - Using Satellite Imagery to Monitor and Manage Crop Development
sbb-itb-0e617ca
Quick comparison
| Tool or signal | What I use it for | Best timing |
|---|---|---|
| NDVI | Vigor, biomass, weak zones, yield swings | Early to mid-season |
| NDRE | Chlorophyll, nitrogen stress, dense canopy changes | Mid to late season |
| MSAVI | Sparse stands, bare-soil fields, early stand checks | Early season |
| Thermal / canopy temp | Water stress, irrigation misses, hot spots | All season, especially reproductive stages |
| Sentinel-2 | In-season scouting and repeat checks | Every 5 days, cloud-free |
| Landsat | Multi-year trends and stable weak zones | Season-to-season review |
| Sentinel-1 SAR | Lodging and structure changes after storms | After severe weather |
My workflow is simple: load field boundaries, watch new images, compare zones over time, scout flagged areas with GPS, confirm the cause, then act fast. That keeps me from wasting time across every acre and helps me focus on the spots most likely to cost me money.
The article below breaks that process into plain steps and shows how I turn maps into field decisions.
Why Early Detection Matters in Cotton Production
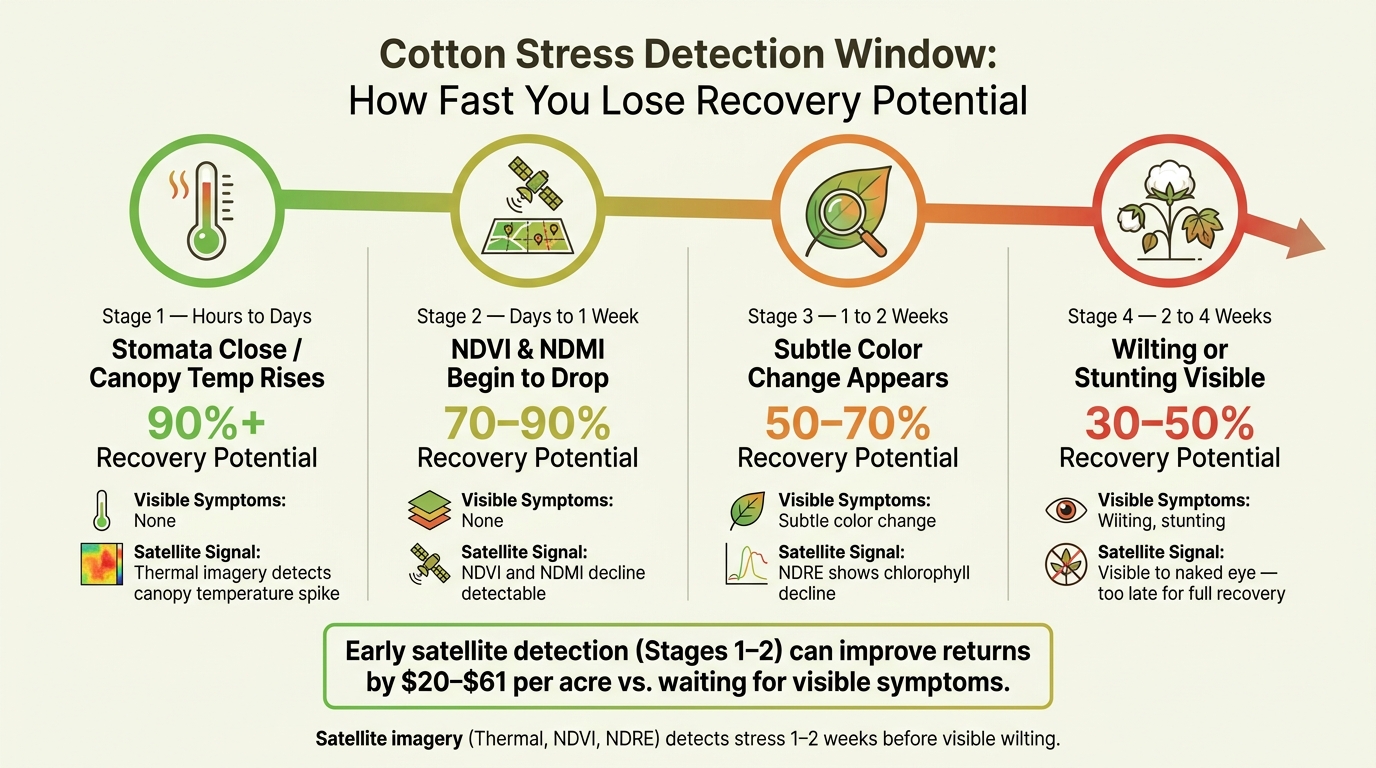
Cotton Stress Detection Window: How Fast You Lose Recovery Potential
Early warning matters because cotton can lose recoverable yield FAST once stress hits reproductive stages. Timing is everything in cotton. When stress shows up during squaring, flowering, and boll fill, boll retention drops and fiber quality starts to slip before you can even see clear symptoms.
How Quickly Cotton Stress Leads to Yield and Quality Loss
Water stress moves in stages, and the early stages are easy to miss. Within hours to days, stomata close and canopy temperature goes up. Chlorophyll decline follows within days. Visible wilting may not show up for 2 to 4 weeks. That gap is exactly why satellite imagery matters. It helps managers take field-level heat-stress patterns and use them across large acre blocks.
If growers catch water stress two weeks before visible symptoms show up, they can recover 70–90% of the potential yield loss. Wait until wilting is visible, and that recovery drops to 30–50%. On the farm, that can add up to about $20–$61 per acre in yield improvement when stress is caught at the physiological stage instead of the visual stage.
The table below shows how fast the intervention window narrows as stress moves forward:
| Stress Stage | Visible Symptoms | Recovery Potential |
|---|---|---|
| Hours to days | None | 90%+ |
| Days to 1 week | None | 70–90% |
| 1–2 weeks | Subtle color change | 50–70% |
| 2–4 weeks | Wilting or stunting | 30–50% |
The longer stress goes unchecked, the fewer acres can still respond to a timely fix.
Where Field Scouting Falls Short on Large Cotton Acres
On large cotton farms, timely scouting gets hard fast during flowering and boll development. Texas alone produces about 25% to 50% of total U.S. cotton. Even with a solid crew, it’s tough to cover every acre during the short periods when flowering and boll development are most at risk. Labor limits, drive time between fields, and the fact that early stress is invisible to the eye all leave blind spots that field scouting can’t fill.
Topography adds another layer. Small elevation shifts - summits, slopes, and low spots - can create dry or saturated pockets that don’t follow neat patterns and are tough to judge from the turnrow. Satellite imagery cuts through that noise by narrowing the search to the few areas that need immediate scouting.
That is why the next step is using imagery to spot specific problems in the field.
What Satellite Imagery Shows in Cotton Fields
Different image layers show different kinds of stress in cotton, which helps you narrow scouting before symptoms spread. They do not tell you the exact problem. They show you where losses may be starting.
Vegetation Index Maps: NDVI, NDRE, and MSAVI Explained
NDVI (Normalized Difference Vegetation Index) tracks canopy vigor, biomass, and growth. In cotton, it can help you spot low-vigor strips, yield swings tied to soil properties and topography, and even root rot before it’s easy to see from the road. Landsat-based NDVI has also been used to track yield variability across Texas cotton fields in dry years.
NDRE (Normalized Difference Red Edge) is more sensitive than NDVI when you’re looking at chlorophyll and canopy density. That makes it useful for picking up smaller shifts in nitrogen status. It can also help separate disease severity in thicker canopies.
MSAVI cuts down soil background noise, so it’s handy in sparse stands or early-season cotton, when a lot of bare ground is still showing.
| Index | Best Used For | When It Matters Most |
|---|---|---|
| NDVI | Biomass, vigor, root rot, yield variability tied to soil properties and topography | Early to mid-season |
| NDRE | Chlorophyll, canopy density, nitrogen status, disease severity | Mid-to-late season |
| MSAVI | Sparse or early-season stands with high soil exposure | Early season |
If vegetation maps show where cotton is starting to slow down, thermal layers show where water stress is already in play.
Thermal and Moisture Signals for Drought and Irrigation Problems
Water stress pushes canopy temperature up, and thermal imagery can catch that shift before wilting shows up. The Crop Water Stress Index (CWSI) compares canopy temperature with air temperature to estimate transpiration stress. Higher values mean stronger water stress.
In open-canopy cotton, WDI often does a better job than CWSI because it accounts for soil background. In a 2021–2022 study in Lubbock County, Texas, WDI outperformed CWSI in separating irrigation treatment levels during early growth stages.
Thermal alerts can also point to irrigation gaps, like clogged drip lines, end-gun misses, or small droughty spots, before wilting becomes plain to the eye.
These signals get a lot more useful when Sentinel-2, Landsat, or your farm platform keeps flagging the same zones again and again.
How to Use Sentinel-2, Landsat, and Farm Platforms to Make Decisions
Sentinel-2 is especially useful for in-season cotton management. Its twin satellites provide imagery at 10 m to 20 m resolution with a 5-day revisit cycle. Its red-edge bands also make it a strong fit for NDRE and NDI45 calculations. In a 2018 study on the Southern High Plains of Texas, Sentinel-2-derived NDI45 achieved an R² of 0.6269 in estimating cotton stem water potential.
Landsat provides 30 m resolution with an 8- to 16-day revisit window. That makes it a good choice for multi-year trend analysis and for finding stable management zones.
Farm platforms help turn raw imagery into scouting zones and alerts. Ed Barnes of Cotton Incorporated says image quality has improved enough to make remote imaging practical at farm scale.
A simple way to use the maps:
- Flag the worst zones first
- Walk those areas before the next irrigation or treatment call
- Use the map to rank scouting zones before the next irrigation set or spray pass
Cotton Problems Satellite Imagery Can Help You Catch First
Satellite alerts usually show you where to look first, not exactly what's wrong. That still matters a lot in cotton. If you can spot trouble early, you can scout the right acres sooner and avoid losing time across the whole field.
Drought Stress, Irrigation Gaps, and Uneven Water Application
Water stress often shows up in imagery before you can see wilting from the turnrow. As stomata close, canopy temperature goes up, while NDMI and NDVI start to drop before visible symptoms appear. That early warning is a big deal during flowering and boll fill, when stress can hit yield hard.
Thermal imagery is especially good at spotting irrigation system issues. Hot zones along pivot tracks or drip lines often point to clogged nozzles, leaks, or other hardware problems, not a field-wide drought event. If a thermal alert lights up a zone, use WSI above 0.5 or evapotranspiration at 50%–60% of potential as your signal to check it on the ground. Then confirm with a pressure chamber reading or a soil moisture probe before changing the irrigation schedule.
That same pattern-based approach also helps with problems that aren't tied to water.
Nutrient Deficiencies, Salinity, Insect Pressure, and Disease Spread
These issues often appear as low-vigor patches that stick around, damage along field edges, or sudden local drops in NDVI and NDRE. The shape of the problem matters almost as much as the index itself. It helps you shrink the scouting area before symptoms move across the field.
If a zone shows low NDRE but a normal thermal signature, that usually points more toward a nutrient issue than a water issue. In that case, pull tissue samples before sending out a fertilizer spreader. Salinity often shows up as low-vigor zones that repeat year after year and line up with high soil electrical conductivity (ECa). Insect and disease pressure often appears as fast, local NDVI or NDRE drops that don't match irrigation zones or soil type boundaries. Radial spread patterns can hint at disease, while edge-following patterns often suggest insect pressure.
Once a pattern starts to fit a likely cause, check it in the field. Ground-truth flagged zones with GPS and look for pests, disease symptoms, or tissue discoloration before making a treatment call.
Uneven Stand, Compaction, and Storm Damage
Early-season MSAVI maps can point out skips, crusting, or uneven emergence before stand gaps turn into yield loss. Compaction usually shows up as linear or low-vigor zones that match past equipment traffic. A penetrometer test can confirm that pretty fast.
Severe weather can also show up clearly in imagery, often as a sudden field-wide drop in NDVI or MSAVI. For lodging, SAR (Synthetic Aperture Radar) data from Sentinel-1 is useful because it can detect structural changes that optical sensors may miss. After a major weather event, a fast field walk through flagged zones can help you check boll retention and harvestability before you make harvest timing decisions.
Use the table below to connect the image signal with the field problem most likely behind it.
| Cotton Problem | Likely Index or Signal | Early Satellite Symptom | Field Check to Confirm | Typical Response |
|---|---|---|---|---|
| Drought stress | NDVI, NDMI, CWSI, WDI | Rising canopy temp; declining NDMI | Pressure chamber; soil moisture probe | Prioritize irrigation; check irrigation system |
| Irrigation gap | Thermal (LST) | Hot zones along pivot or drip lines | Inspect nozzles and leaks | Repair hardware; adjust irrigation |
| Nutrient deficiency | NDRE | Low NDRE; patchy NDVI decline | Tissue test; soil sample | Targeted fertilizer application |
| Salinity | NDVI (multi-year trend) | Persistent low-vigor zones matching high ECa | Soil salinity test | Adjust leaching fraction; zone management |
| Insect or disease | NDVI, NDRE | Rapid, localized canopy decline | Scout for pests or fungal signs | Targeted spray after confirmed ID |
| Uneven stand / compaction | MSAVI, early NDVI | Linear or low-vigor zones | Penetrometer; stand count | Replant if needed; long-term drainage or soil-structure fixes |
| Storm damage or lodging | SAR (Sentinel-1), NDVI | Sudden widespread NDVI drop; backscatter shift | Assess boll retention and plant structure | Adjust harvest timing; evaluate damage extent |
A Simple Workflow for Using Satellite Imagery in Cotton Scouting
Use the same workflow each time to turn satellite alerts into scouting and treatment calls. Once the map shows where stress is building, you can decide where to scout first instead of walking every acre the same way.
Load Field Boundaries, Layers, and Alerts
Start by uploading field boundaries into your farm platform so imagery lines up with each field. Use NDVI, thermal imagery, and NDRE as your core layers. Set stress alerts, then compare each field with its past management zones so the platform picks up true changes, not areas that are usually weaker. That makes it easier to sort fields by urgency.
After the layers are in place, use time-series comparison to tell the difference between weak zones that show up again and again and stress that just appeared.
Compare Maps Over Time and Ground-Truth Flagged Areas
Check each new cloud-free image and compare it with the prior pass. That trend helps you decide whether to scout for water stress, fertility problems, or acute damage. Use cloud masking to filter cloudy pixels, then give the image a quick visual check for shadows or haze. If the flagged area looks valid, go straight to it with a GPS-enabled app and confirm what’s happening in the field.
Once you confirm the alert on the ground, don’t let it sit. Move from diagnosis to action while the problem is still contained.
Turn Confirmed Problems Into Field Actions
The point isn’t just to find stress. It’s to act before it spreads. After you confirm the cause, match the fix to the problem. Put water stress first during flowering and boll fill, and check soil, elevation, and conductivity maps before changing fertility. If a zone shows low NDVI but normal thermal and moisture signals, scout for pests or disease before adding irrigation.
Satellite guidance also helps you measure the number of stressed acres before ordering a spot treatment.
How Better Field Decisions Support Cotton Gins and Harvest Logistics
Why Healthier Cotton Supports Gin Efficiency and Lint Quality
Once a problem is confirmed and fixed, the payoff doesn’t stop in the field. It shows up at harvest and later at the gin.
Early action on water or nutrient stress helps keep the crop more uniform. That often means steadier moisture and less trash at the gin, which can support better ginning efficiency and turnout. In one case, weekly satellite-based management zones improved water productivity by 19% and reduced field variability.
Imagery can also point to excessive vegetative growth. Too much irrigation or nutrient imbalance can lead to rank cotton, which slows maturity and makes ginning more difficult. USDA-ARS researchers note that canopy-temperature imagery helps growers time irrigation and balance vegetative and reproductive growth.
The same imagery isn’t just useful for protecting yield. It can also help growers line up harvest timing.
Using cottongins.org to Plan Delivery and Regional Coordination
NDVI trends can help rank fields by maturity, which makes it easier to schedule harvest and gin delivery before machines start rolling. That’s where cottongins.org comes in. It’s a directory of U.S. cotton gins, searchable by state and county, that helps growers plan hauling distances and coordinate harvest across a region.
Used this way, imagery supports decisions from midseason scouting all the way through harvest planning.
Conclusion: Spot the Pattern Early, Check It in the Field, Act Before Losses Grow
Satellite imagery works best when it leads to action: flag the problem, scout the zone, confirm the cause, and respond fast. The growers who get the most from it treat it like a routine part of the job, not just another report.
FAQs
How often should I check satellite imagery on cotton fields?
Check imagery based on what you need to monitor. Free satellite services often give you weekly passes, which work well for watching seasonal progress. Paid services may provide daily high-resolution imagery, which helps when conditions shift fast.
For many growers, imagery every 3 to 5 days is a good fit for field decisions. No matter what schedule you use, walk fields weekly to confirm what the imagery is showing.
What should I do first after a stress zone appears on the map?
First, ground-truth the alert with a field visit. Satellite imagery can throw off false positives. A shadow from tall cotton plants, for example, can look like a problem when there isn’t one. So before you act, check the field and confirm what’s actually happening.
Then match what you see on the ground with the map. That helps you tell whether the problem is insect damage, a nutrient deficiency, or an irrigation issue, so you can make a timely, targeted response.
Which imagery layer is best for my cotton problem?
It depends on what’s putting the crop under stress.
Use NDVI to check general crop vigor and spot early nitrogen stress. Turn to thermal imagery when you need to catch early moisture issues. If your goal is the most sensitive way to detect water stress, go with WDI. Sentinel-2 NDRE helps you see chlorophyll drop sooner, and SAR is useful for storm damage or lodging when the crop still appears green.
Before you act on any alert, ground-truth it to confirm the cause.