Cotton profit often comes down to one thing: using inputs by zone instead of by field average. From the article, the clearest takeaway is simple: if I use GPS guidance, yield maps, soil tests, moisture data, and field records together, I can cut waste, protect yield, and make better acre-by-acre profit calls.
Here’s the short version:
- GPS auto-steer and section control cut overlaps and skips during planting and spraying.
- Yield maps show which parts of a field keep paying and which parts drag margin down.
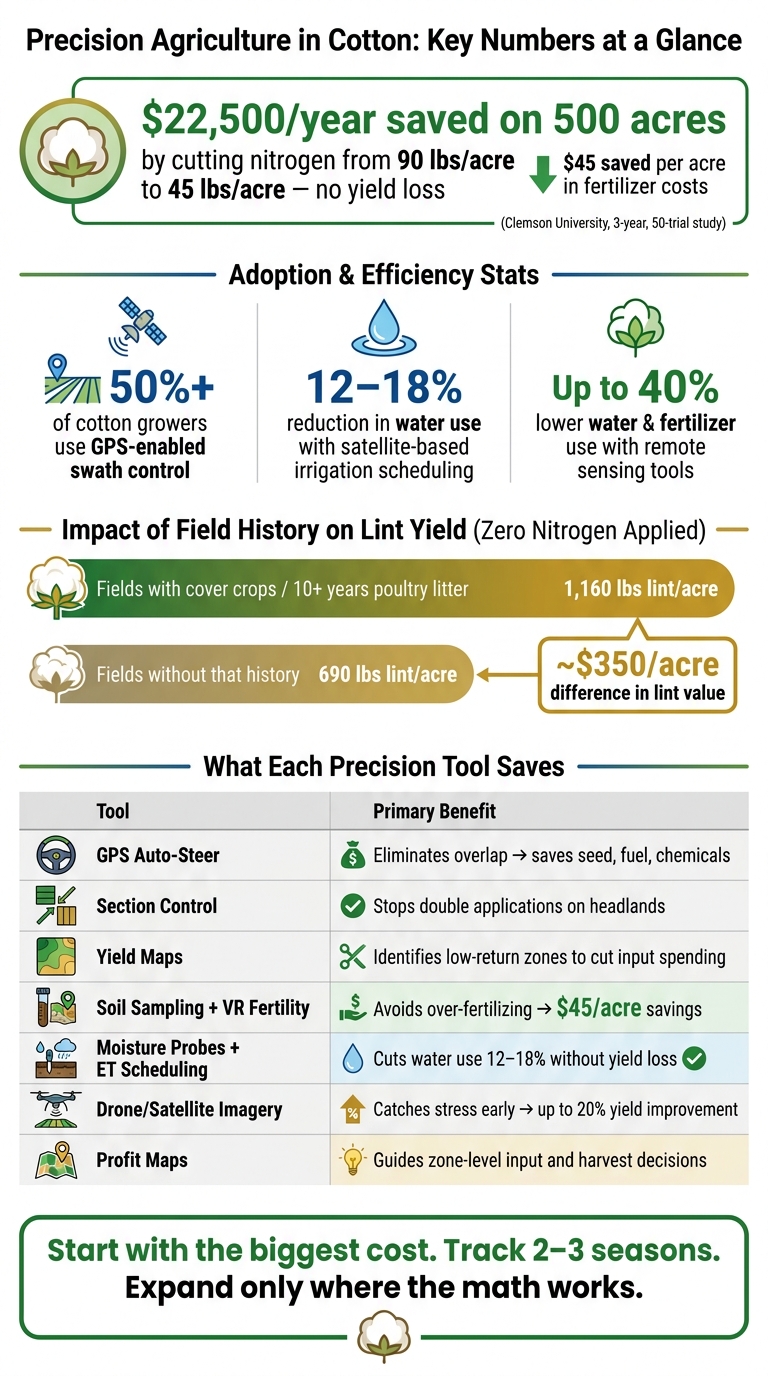
- Soil sampling and variable-rate nitrogen can trim fertilizer costs. In one Clemson study, cutting nitrogen from 90 lbs./acre to 45 lbs./acre saved about $45 per acre, or $22,500 a year on 500 acres, with no yield loss.
- Soil-moisture probes, ET scheduling, drones, and satellites help time irrigation and spot stress sooner.
- Zone-level records and profit maps turn field data into input, harvest, and gin decisions.
A few numbers stand out:
- More than 50% of cotton growers use GPS-enabled swath control.
- Satellite-based irrigation scheduling cut water use by 12% to 18% without hurting yield.
- Remote sensing studies linked these tools to up to 40% lower water and fertilizer use.
- Some fields with cover crop or poultry litter history held high yields with zero added nitrogen.
If I had to sum up the article in one line, it would be this: start with the biggest source of waste, track results for two to three seasons, and expand only where the math works.
| Tool or data | What it helps me do | Main money angle |
|---|---|---|
| GPS auto-steer | Reduce overlap | Lower seed, chemical, and fuel waste |
| Section control | Shut off covered rows/sections | Fewer double applications |
| Yield maps | Find weak and strong zones | Shift spending to better acres |
| Soil sampling | Check nutrient need by zone | Avoid extra fertilizer |
| Moisture probes + ET | Time irrigation by demand | Lower water use |
| Drone/satellite imagery | Spot stress early | Fix issues before yield drops |
| Profit maps | Compare cost vs. return by zone | Better field-by-field decisions |
Bottom line: the article shows that cotton growers do not need every tool at once. I’d start with the data that cuts the biggest cost first, then build from there.
Precision Agriculture in Cotton: Key Stats & Savings by Tool
Cutting Input Waste With GPS Guidance, Coverage Maps, and Yield Data
How Auto-Steer and Section Control Lower Costs in Planting and Spraying
Every pass across a cotton field costs money in fuel, labor, and product. When steering is done by hand, overlaps and skips happen more often. That can mean double-applying seed, fertilizer, or chemicals in some areas while missing other spots altogether.
GPS auto-steer keeps equipment moving on a precise path. Section control takes that one step further by shutting off planter or sprayer sections as the machine moves over ground that was already covered, like headlands or odd-shaped field edges. That cuts waste where it usually sneaks in.
Coverage maps make those overlaps, skips, and missed edges easy to spot. Instead of guessing, growers can see where product was wasted and where savings came from.
"Autosteer reduces operator stress and can improve input use efficiency by eliminating skips and over application due to overlaps." - Ed Barnes, Researcher, Cotton Incorporated
More than 50% of cotton growers now use GPS-enabled swath control to avoid overlap during planting and chemical applications.
How Yield Maps Show Which Field Zones Are Profitable and Which Are Not
Auto-steer and section control help cut waste during the season. Yield maps show what happened at harvest, and that matters just as much.
A yield monitor records harvest data across the field. GPS mapping then turns that data into a clear picture of which zones keep producing more lint and which ones fall behind. After two or three seasons of layered yield maps, the pattern starts to stand out: some zones keep paying, and some don’t.
That gives growers a better way to make input decisions. They can pull back on weaker cotton acres and focus more closely on the parts of the field that respond better. It’s also the kind of field-by-field detail used to fine-tune fertility and irrigation by zone.
Those yield patterns also show where soil sampling, variable-rate fertility, and irrigation data are most likely to pay off next.
sbb-itb-0e617ca
Using Soil and Water Data to Apply the Right Inputs in the Right Places
Soil Sampling and Variable-Rate Fertility for Better Fertilizer Returns
Yield maps show where a field is underperforming. Soil and water data help explain why - and what to do next.
Pre-plant soil sampling fills in the gaps that yield maps leave behind. It tests nitrate and ammonium in the top 0–12 inches and factors in crop history, tillage system, soil organic matter, water-holding capacity, and erosion risk. With that data in hand, growers can build variable-rate fertility prescriptions instead of spreading the same fertilizer rate across every acre. That shift lets each zone get what it needs, and no more. The payoff is better return per acre.
The dollar impact can be hard to ignore. In a three-year, 50-trial study, Clemson University researchers Bhupinder Farmaha and Shikha Dubey found that 68% of cotton fields needed less nitrogen than blanket recommendations called for. Dropping rates from 90 lbs per acre to 45 lbs per acre - at about $1 per pound of nitrogen - saves around $45 per acre. On a 500-acre farm, that's about $22,500 per year kept on the operation's side of the ledger, with no yield penalty.
Field history can push those returns even further. Ground with long-term cover crops or 10+ years of poultry litter applications may need little or no added nitrogen to hold high yields. In Farmaha's work, those fields averaged 1,160 lbs of lint per acre with zero nitrogen applied, compared with 690 lbs per acre on fields without that history. That's a gap worth about $350 per acre in lint value.
Precision Irrigation Using Soil Moisture Data, ET Scheduling, and Field Zoning
Cotton doesn't give much room for error during bloom and boll fill. Water stress at the wrong time can cost yield fast, so irrigation timing matters.
Soil-moisture sensors and ET data help growers irrigate based on crop demand instead of sticking to a set calendar. Then field zoning sharpens the plan. Thermal drone imagery and satellite data can spot differences across the field, which makes it possible to build prescription maps that match water rates to each zone's needs.
"We can create a prescription map and tell them what is the best rate at that particular location relative to the other locations within the same field... people know they can maximize their water use efficiency for the field and enhance profitability." - Wenxuan Guo, Precision Irrigation Researcher, Texas Tech
That kind of zoning isn't just theory. Research using satellite-based machine learning frameworks for cotton irrigation scheduling found an average 12–18% cut in total water application without hurting yield. When growers track those zone maps in farm records, the data can do more than guide irrigation - it can shape harvest-time decisions too.
Using Drone and Satellite Imagery to Catch Mid-Season Crop Problems Early
Even with solid fertility planning and irrigation scheduling, in-season issues still show up. The trick is finding them before they spread.
Multispectral imagery can flag low-chlorophyll areas that point to nitrogen deficiency before visual symptoms show up. Thermal imagery can detect canopy temperature differences by zone, which helps trigger irrigation events with more precision than a windshield check or a walk through the field.
Studies on remote sensing have linked these tools to a 20% increase in crop yield and up to a 40% cut in water and fertilizer use. Once those alerts are logged by zone, growers can connect mid-season action to end-of-season results instead of treating each problem like a one-off event.
Turning Cotton Field Data Into Profit Decisions With Software and Records
Building Field-Level and Zone-Level Profit Maps
Data starts to matter when you put the pieces together. Yield maps, soil tests, input records, and irrigation logs can be combined into zone-level profit maps that show where money is made and where it slips away.
When growers layer actual cost categories - seed, fertilizer, irrigation, chemicals, labor, and machinery - on top of yield maps, weak zones stand out fast. If one part of a field keeps producing less at the same input rate, that zone is eating into margin. That gives you a clear next move: cut inputs there, change irrigation, or put more of the budget into areas that give a better return.
That zone-level view also sets up better harvest and logistics choices later in the season.
Connecting Precision Decisions to Harvest Timing, Fiber Quality, and Gin Logistics
Once zones are mapped, the same data can help guide harvest timing and gin planning.
In April 2026, the Texas A&M AgriLife Research and Extension Center at Corpus Christi launched a project with 11 cotton producers across the Texas Coastal Bend. Led by Dr. Juan Landivar, the team built a data hub that delivers near-daily crop updates, heat maps, and digital twins for PGR timing, defoliation, and late-season lint-yield forecasts.
Those lint-yield forecasts help growers estimate harvest volume and plan gin delivery. RFID tags on round modules can also trace cotton from sub-field zones to gin.
Key Records to Track So the Numbers Show a Real Return
These decisions only mean much if they're logged in one consistent record system. Otherwise, it's hard to tell what worked, what didn't, and where the dollars went.
| Data Layer | Decision Influenced | Expected Financial Impact |
|---|---|---|
| Yield Maps | Identify chronically weak zones | Lower cost per acre on marginal ground |
| Soil Moisture Probes | Irrigation scheduling and volume | Record actual water applied per zone |
| NDVI / Canopy Imagery | Variable-rate nitrogen timing | Track fertilizer rate adjustments by zone |
| RFID Module Tags | Gin logistics and traceability | Improved fiber quality and logistics |
| Digital Twins | Defoliation and PGR timing | Record harvest timing decisions by zone |
The main point is consistency across more than one season. That's what turns a one-off gain into a system you can keep using. Track nitrogen-use efficiency as lint yield per pound of nitrogen applied to see whether fertility spending is paying off year over year.
Conclusion: A Practical Starting Plan for Higher Cotton Returns Per Acre
Start With the Biggest Cost or Yield Problem First
Once the data is organized, fix the biggest leak first.
That’s where the fastest payback usually comes from. Not from adding every tool at once, but from solving the biggest problem before anything else. For many growers, that first issue is overlap and skips. Autosteer is often the simplest place to begin because it cuts overlap without much setup. It can save money fast since it needs far less setup than prescription-based tools.
After overlap is under control, pick the next step based on where losses are highest. In irrigated fields, start with soil-moisture probes and ET-based scheduling. In dryland fields with variable soils, yield maps are often the better first move because they show which zones keep earning full inputs and which ones don’t.
Measure Results Across More Than One Season
Once the first change is in place, track results long enough to see if it sticks.
One season usually doesn’t tell the whole story. Cotton response to inputs shifts with weather, soil variability, and timing. Because of that, researchers studying variable-rate nitrogen often use two to three years of field data before making firm calls on profit.
Track the numbers that tie straight to profit:
- lint yield
- fertilizer rate
- nitrogen-use efficiency
- net returns across seasons
The best returns usually come from starting small, measuring what happens, and expanding only when the numbers show it’s worth it.
Looking at Precision Ag Adoption in Cotton
FAQs
What precision ag tool should I start with first?
Start with soil mapping and grid sampling. They show you how conditions change across a field and give you a solid base for smarter input choices instead of blanket applications.
Then move to autosteer technology. It’s a practical next step because many growers already use it, setup is minimal, and it’s often standard on newer equipment. As your operation grows, you can add variable-rate technology, satellite imagery, or drones.
How long should I track data before changing inputs by zone?
Track data for at least 2 years before you change inputs by zone. That gives you a steadier read on spatial trends and makes it easier to spot low-return zones before the next season.
Review harvest and field performance data every year. A yield variance below 10% can be a sign that the plan is working, and written logs beat memory when you’re comparing zones.
How do I know if a weak zone should get fewer inputs?
Use yield maps, drone-based NDVI imagery, and soil sensing data to spot weak zones where inputs just aren’t paying off. Yield maps are especially helpful here because they show which parts of a field stay unprofitable year after year.
If NDVI or plant-based sensors keep showing little response after higher input rates, that’s a pretty clear signal: those zones likely need less, not more. In low-potential areas, variable-rate applications can cut fertilizer use by 15%–20% and seed use by 5%–10% without reducing yields.