Yes - precision ag in cotton can pay, but the math is uneven. From the farm cases in this article, the best returns came from soil moisture sensors, variable-rate fertility, and GPS guidance, while remote sensing had the least consistent payoff unless it changed a spray, irrigation, or scouting decision.
If I boil the article down to the numbers that matter most, here’s what stands out:
- Whole-system precision setups got cheaper per acre as farm size grew:
- about $16.55/acre on 356 acres
- about $3.90/acre on 3,560 acres
- Input savings in one cotton case averaged $24.09/acre
- A 900-acre cotton case showed:
- $9.16/acre in input savings
- $2.68/acre net return
- about 3.5 years to pay back
- about 38% rate of return
- Variable-rate fertilizer cut fertilizer cost by as much as 41% in one comparison
- Soil moisture sensors added about $24 to $35/acre in profit in published cotton cases
- Water savings from sensor-based scheduling reached 1.91 acre-inches/acre/year in one long-term case
- GPS guidance trimmed fuel use by about 5% to 10%, with fuel overlap savings of about 0.11 to 0.14 gallons/acre
- Remote sensing looked most useful for targeted scouting, fewer unneeded sprays, and spotting problem zones early, but direct U.S. cotton ROI data was thin
What does that mean for you?
Precision ag paid best when it cut a known cost on a lot of acres. That usually meant:
- high fertilizer spend
- high pumping cost
- irregular fields with overlap waste
- enough acres to spread fixed system cost
And it paid worst when:
- acres were too low
- fields were fairly uniform
- the tool produced data but no changed action
- ownership, service, and data costs ate up the savings
The short version: if I were sizing up cotton precision tools, I’d start with irrigation scheduling, then fertility, then guidance, and I’d treat drone or satellite scouting as a support tool unless I could tie it to fewer passes, fewer sprays, or better timing.
A quick way to judge any purchase is to ask:
- How many acres will this tool cover?
- What cost per acre will it cut?
- Will it change yield, or just input use?
- How long until the savings cover the annual and upfront cost?
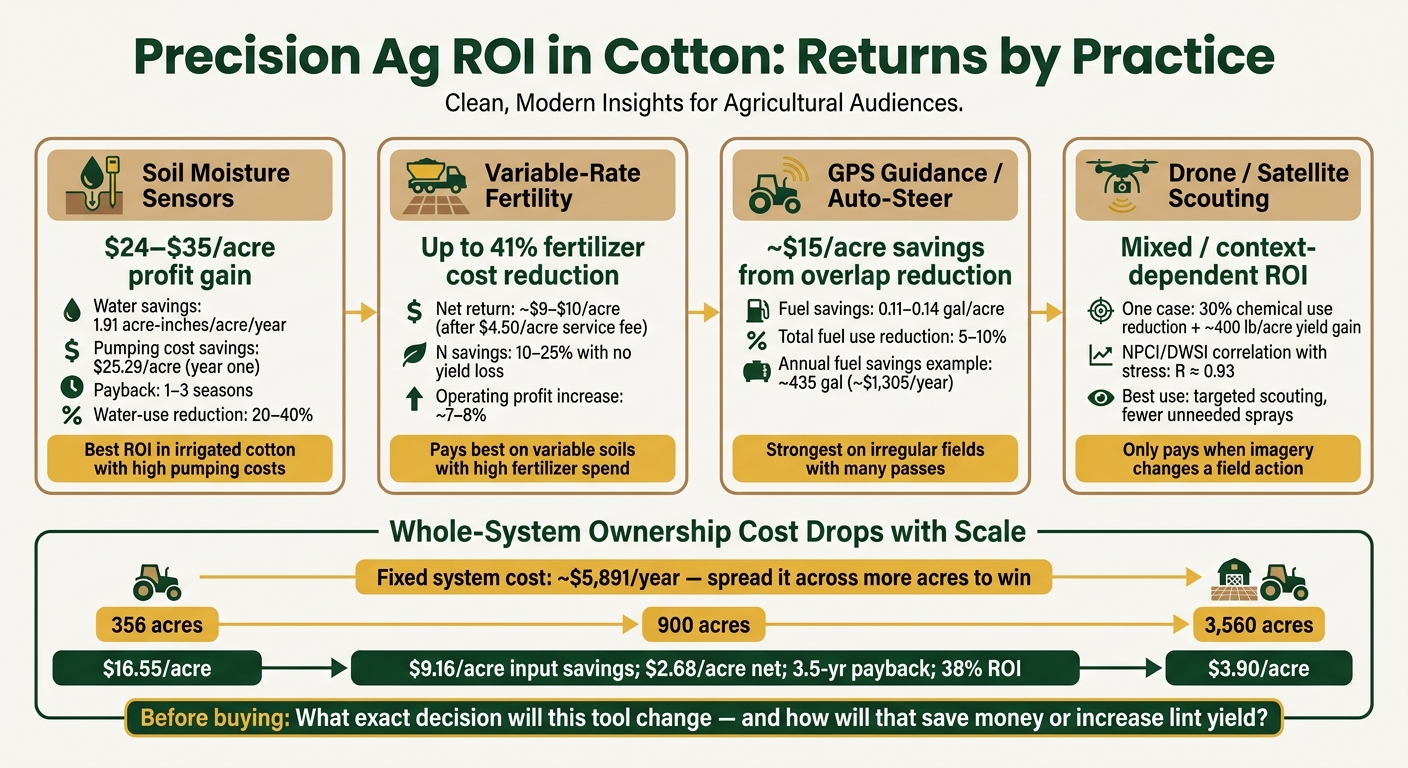
Precision Ag ROI in Cotton: Returns by Practice
Quick Comparison
| Practice | Main payoff | Reported return range |
|---|---|---|
| Soil moisture sensors | Lower water and pumping cost; sometimes better yield | About $24 to $35/acre profit gain; often 1 to 3 seasons payback |
| Variable-rate fertility | Lower fertilizer use with similar yield in many cases | About $9 to $10/acre net in one case; fertilizer cuts up to 41% in one comparison |
| GPS guidance / auto-steer | Less overlap, fuel, and wasted passes | Fuel use down about 5% to 10%; direct per-acre gain depends on passes and field shape |
| Full precision system | Combined savings across tools | Works better at more acres; ownership cost fell from $16.55/acre to $3.90/acre in one analysis |
| Drone / satellite scouting | Better field targeting | Mixed payoff; works best when it changes a field action |
Bottom line: I’d use this article as a filter, not a sales pitch. The farms that made money with precision ag had one thing in common: the tools changed day-to-day decisions in ways that cut costs or protected lint yield.
sbb-itb-0e617ca
Whole-Farm Precision Systems: Returns From Bundled Adoption
Bundled systems tend to work better when you spread fixed costs across more acres. In cotton, that scale effect is hard to ignore.
One cotton analysis put the annual ownership cost for a full system at $5,891 for a farm running one four-row picker. That package included a yield monitor, GPS, mapping software, and variable-rate controllers. On 356 acres, the cost came to about $16.55 per acre. On 3,560 acres, it dropped to about $3.90 per acre.
That estimate also covered software and data-related expenses, including soil sampling, cleaning, and consulting. So the basic ROI test in cotton is pretty simple: do the yearly savings beat the yearly ownership and data costs?
Measured Savings, Yield Changes, and Break-Even Points
Once those fixed costs are spread across enough acreage, the next issue is straightforward. Are the annual savings and yield gains big enough to cover the bill?
In one cotton demonstration, reported input savings averaged $24.09 per acre. Yield results also leaned positive. In one Mississippi survey, 83% reported lint gains of 10 to 250 lb/acre, while 17% saw no change, and none reported a decline. A six-state Southeastern survey found an average reported yield gain of about +21 lb/acre among adopters of variable-rate inputs.
Here’s how that looked at different farm sizes:
| Farm scenario | Ownership cost/acre | Input savings/acre | Reported outcome |
|---|---|---|---|
| ~356 acres | $16.55 | ~$24.09 | Harder to justify without strong savings |
| ~900 acres | Not reported | $9.16 | $2.68/acre net return; ~3.5-year payback; ~38% rate of return |
| ~3,560 acres | $3.90 | ~$24.09 | Savings alone can cover ownership cost |
The 900-acre West Tennessee case gives the clearest mid-size benchmark. On about 900 cotton acres, a decision-aid study of variable-rate fertilizer showed a net return of $2.68 per acre, driven by $9.16 per acre in input savings.
Using a 10-year equipment life and nine annual passes, the system reached profitability after about 3.5 years, with a rate of return around 38%. That’s a decent result, but it also shows how much the math depends on acreage and use. If the system sits idle or covers too few acres, the cost per acre stays stubbornly high.
On smaller farms, whole-system economics weakened when input savings failed to cover fixed ownership and data costs.
Next, the economics shift from whole-farm systems to individual practices: fertility, irrigation, and guidance.
ROI by Practice: Fertility, Irrigation, and Field Operations
Practice-level ROI is usually simpler to size up: one tool, one cost, one payoff.
Variable-Rate Fertility and Yield Mapping
Fertility is often the first place farms start. That makes sense. Fertilizer is one of the easiest inputs to adjust by field zone, so the math is easier to see.
Variable-rate fertilizer programs tend to pay best when soil differences are clear and measurable. In irrigated cotton, remote sensing-based variable-rate nitrogen management has delivered 10–25% savings in N fertilizer compared with soil-test-based uniform rates, with no drop in lint yield. West Texas LEPA-irrigated cotton trials also showed lower phosphorus fertilizer use under variable-rate management, again without hurting yields.
One cotton case study puts numbers on it. Variable-rate nitrogen management used about 98 lb/acre of N and produced about 996 lb/acre of lint. After a service fee of about $4.50/acre, variable-rate N improved net return after nitrogen cost by about $9–$10/acre. Another precision cotton study found fertilizer cost cuts of around 40% for certain inputs, such as phosphorus or limestone, while total operating profit increased about 7–8% even when lint yields stayed flat.
Startup costs are often lower than growers expect. A variable-rate ground applicator controller costs around $3,000, and GPS receivers add about $100–$2,500 depending on the accuracy needed. There’s also a way to keep sampling bills in check: management zones built from EC maps, field shape, and past yield maps can reduce soil sampling costs compared with dense grid sampling.
If fertilizer savings come in light, irrigation often ends up being the factor that drives payback.
Soil Moisture Sensors and Irrigation Scheduling
In irrigated cotton, soil moisture sensors have one of the clearest ROI cases in precision ag.
A long-term case study using soil moisture probes to schedule cotton irrigation found water savings of 1.91 acre-inches per acre per year and pumping-cost savings of $25.29/acre in year one. Across the monitored fields over a 10-year period, cumulative pumping savings topped $32,000. Broader sensor-based scheduling data show water-use cuts of 20–40% and energy or pumping cost reductions of 10–30%, along with yield gains of 5–15% in water-limited conditions.
One detail matters a lot: the highest yield is not always the highest profit. In a cotton trial testing soil moisture thresholds, plots irrigated at −15 kPa produced the most lint yield, but plots at −30 kPa delivered the highest net return above irrigation cost and the best irrigation water-use efficiency. When pumping costs are high, that difference matters. Savings of $20–$30/acre/year often pay back sensors in 1–3 seasons.
After water savings, guidance is usually the easiest next step.
GPS Guidance, Auto-Steer, and Overlap Reduction
Once water is under better control, the next efficiency gain often comes from cutting wasted passes.
GPS guidance and auto-steer save money in a pretty direct way: less overlap and fewer skips mean less wasted input and fuel on every trip across the field. Missouri data show that GPS-guided overlap reduction saved about 0.11–0.14 gallons of fuel per acre. North Dakota farms using GPS guidance reported average annual fuel savings of about 435 gallons, worth about $1,305 at typical diesel prices. Across multiple operations, total fuel use fell 5–10% after GPS guidance was adopted.
Put simply, GPS guidance and auto-steer save about $15/acre by cutting overlap, skips, and extra passes.
Drone and Satellite Scouting: Current Economics in Cotton
After overlap reduction, the next place farms can save is simple: send scouts only where the crop looks risky. Remote sensing can help cotton growers spot field variation early, but it only pays when it changes a decision on spraying, irrigation, or scouting.
Drones and satellites can flag canopy vigor, stand gaps, uneven irrigation, water stress, and broad pest or disease risk. But imagery alone can't tell you why it's happening. It can point to a problem area, not give a full diagnosis. UAV thermal imagery can map current water stress, and multispectral indices beyond basic NDVI, such as NPCI (Normalized Pigment Chlorophyll Ratio Index) and DWSI (Disease Water Stress Index), have shown correlations as high as R ≈ 0.93 with cotton reddening stress. That points to strong early-detection potential for nutrient or disease-linked discoloration. USDA ARS work in the Mid-South also found large spatial variation in cotton stand counts at the same seeding rates, tied to soil texture differences. That's exactly the kind of pattern imagery can flag, but not fully explain without boots-on-the-ground checks.
Once imagery marks a risk zone, the value comes down to what happens next. The clearest payback tends to come from:
- targeted scouting
- fewer unneeded sprays
- faster problem detection
That saves money when scouts and applicators stay off low-risk acres. The math tends to work best on large, variable fields, where even a small gain affects a lot of acres.
Historical imagery has helped with chronic issues too. Archival airborne and satellite data have been used to map cotton root rot infection zones and create site-specific fungicide prescription maps at planting. In other words, old imagery can become a planting prescription.
The table below compares drones and satellites on the factors that matter most for cotton economics:
| Factor | Drone | Satellite |
|---|---|---|
| Typical direct cost | Higher per acre; lower for targeted use | Lower per acre at scale |
| Best economic use in cotton | Urgent problem zones, post-storm inspection, detailed pest checks | Routine field prioritization, trend monitoring, irrigation zone mapping |
Direct ROI figures for remote sensing in cotton are thinner than the numbers available for fertility or irrigation practices. One case from Xinjiang Province showed a 30% cut in chemical use and a yield increase of 450 kg/ha - about 400 lb/acre - in the 2021 crop year when a grower used a multispectral scouting drone and a spraying drone, with imagery used to build a prescription map. That said, those results came from a production setting different from U.S. cotton.
So the returns can be mixed. That's why side-by-side, practice-by-practice comparison is the real test. The next step is straightforward: which precision tools paid back fastest, and what should a grower run through the numbers before buying?
Which Precision Practices Paid Off Most and What to Check Before Buying
Where Returns Were Strongest by Practice
Across the case studies, ROI had less to do with the tool alone and more to do with one thing: did it change a farm decision? Data only pays when it leads to a different fertilizer rate, fewer pump hours, or one less spray pass.
Variable-rate fertility paid best on farms with variable soils and more acres. On uniform fields, returns were much weaker.
Soil moisture sensors showed the best returns in irrigated cotton where pumping costs were high. That makes sense. If water is expensive to move, better timing can save a lot.
GPS guidance paid back through less overlap and fewer passes. The strongest returns showed up on irregular fields, where wasted movement adds up fast.
Remote sensing had the weakest and most uneven ROI. It only paid when the imagery led to a fast field action. Pretty pictures alone don't save money.
The buying test is simple: stack those gains against your own acres, costs, and payback target.
Key Numbers to Calculate on Your Own Farm
| What to Calculate | Why It Matters |
|---|---|
| Acres covered by the system | Spreads fixed costs; more acres = lower cost per acre |
| Current fertilizer cost/acre by nutrient | Sets the baseline for variable-rate savings estimates |
| Current pumping cost/acre (electricity or diesel) | Determines irrigation sensor payback potential |
| Average lint price assumption (e.g., $0.70–$1.00/lb) | Affects how much a yield change is actually worth |
| Realistic input savings (%) from extension or neutral case studies | Keeps projections grounded, not vendor-optimistic |
| Expected yield effect (lb lint/acre) based on similar farms | Separates realistic gains from best-case demos |
| Annual and upfront system cost per acre | Full cost picture for payback math |
| Required payback period | Tests whether projected gains meet your risk threshold |
Before signing anything, boil it down to one plain question: What exact management decision will this tool change, and how will that change save money or increase lint yield on my farm? If you can't answer that in concrete terms, the ROI case probably isn't ready.
FAQs
How many acres do I need for precision ag to pay in cotton?
It depends on the tool.
For general precision ag tools like GPS autosteer and variable-rate seeding, farms with as little as 500 acres may be able to justify the cost through savings on labor, seed, and fuel.
More specialized systems, such as see-and-spray, usually need 13,000 to 20,000 acres and herbicide costs above $10 per acre to pencil out. In many cases, field variability matters just as much as total acreage.
Which precision ag tool usually pays back fastest in cotton?
In cotton, the fastest payback usually comes from tools that cut overlap and input waste, especially GPS guidance (autosteer), section control, and variable-rate application.
Autosteer tends to pay back first. It cuts overlap and machine hours during planting, spraying, and strip-till. In plain terms, it helps you cover the same ground with less waste and less time in the seat.
For many growers, tools like these often pay back within one to two years. See-and-spray systems are a different story. Their payoff usually depends much more on farm scale.
How should I calculate my own cotton precision ag ROI?
Start by tracking the cost the tool is supposed to cut. That can include seed, fertilizer, fuel, labor, irrigation hours, machine hours, and final lint yield for each field. Then compare those numbers with past field data or with non-precision check strips.
For guidance tools, use: Acres × Passes × Cost per acre × Overlap percentage saved.
For variable-rate tools, subtract setup and operating costs from input savings and any yield gain. Then check those results across management zones over time.
Related Blog Posts
- Implementing Precision Agriculture in Cotton Farming for Higher Yields
- Implementing Variable Rate Technology in Cotton Farming for Efficiency
- Precision Cotton Farming: Leveraging Digital Tools and Advanced Techniques for Maximum Yield
- Transforming Cotton Farming With Technology and Precision Agriculture