If I had to sum it up in one line: drones help me see cotton water stress early, use less water where I can, and protect yield where it counts.
Here’s the short version:
- Thermal cameras show hot crop areas before stress is easy to spot on foot.
- Multispectral images show weak vigor, uneven stands, and crop differences across the field.
- Flying before irrigation, near solar noon, gives a better read on stress.
- In cotton, this matters most during squaring, flowering, and boll set.
- In one study, drone-guided irrigation improved water productivity by up to 19%.
- In the Texas High Plains, the stakes are high because about 1.8 million irrigated cotton acres depend on the Ogallala aquifer.
What stands out to me is simple: fixed schedules and spot checks miss too much. A few walk-through points can’t show every dry pocket, nozzle issue, sandy strip, or heat-stressed zone across a full cotton block.
The article shows a clear path I can follow:
- Fly RGB, multispectral, and thermal missions
- Build NDVI, NDRE, CWSI, or WDI maps
- Check hot spots on the ground
- Adjust irrigation by zone
- Track changes over time
The main idea is not just getting images. It’s turning those images into field decisions on water, labor, and irrigation fixes.
A short side-by-side view:
| Tool | What I use it for | What it tells me |
|---|---|---|
| RGB | Stand gaps and visible field issues | Where the field looks uneven |
| Multispectral | Vigor and biomass patterns | Where crop growth is slipping |
| Thermal | Heat stress and irrigation trouble | Where plants may need water now |
If I’m managing cotton in dry areas, sandy soils, or under pivots, this gives me a better way to decide where to act first instead of treating the whole field the same.
Why standard scouting often misses cotton water stress
How water stress appears in cotton before it is easy to see
Cotton often shows water stress before it looks stressed.
As stomata close to hold onto moisture, canopy temperature goes up. Thermal sensors can pick up that change before wilting or color shifts show up in the field. Multispectral indices like NDVI can also spot drops in biomass and chlorophyll before those symptoms are easy to see with the naked eye.
So the issue isn’t whether stress starts early. It’s whether you can catch it before a field walk does.
Where manual scouting and fixed irrigation schedules fall short
Manual scouting has a simple problem: it only covers a small share of a large cotton block.
A field walk usually checks a handful of spots, then uses those spots to stand in for the whole field. That can work for obvious issues. It works a lot less well when water stress shows up in scattered pockets.
In the Texas High Plains, a 2018 USDA survey found that 75% of growers use irrigation demand and 40% use soil moisture to schedule irrigation. Even with those methods, it’s still easy to miss variation inside the field.
Here’s why:
- Soil texture can change across a single block.
- Water-holding capacity can shift from one zone to the next.
- Stress hot spots may sit far from the path a scout happens to walk.
That means one area may need water while another doesn’t. ET-based schedules can then overwater some zones and underwater others when field conditions vary. And coarse imagery can smooth stressed patches into healthy-looking ones, which hides the very problem you’re trying to find.
Growers need tools that map stress across the whole field, not just at a few points. That’s the gap multispectral and thermal drones are built to fill.
sbb-itb-0e617ca
Drone tools that help growers spot crop stress sooner
Multispectral imaging and vegetation maps
Multispectral sensors pick up light bands the human eye can't see, including red edge and near-infrared. That matters because plants often show stress in those bands before leaves wilt or change color. Indices like NDVI turn those shifts into field maps growers can act on, often flagging water availability trouble early.
Not every index tells you the same thing.
- NDVI works well for a broad read on canopy density and biomass.
- NDRE uses the red edge band and is especially useful in thicker mid- to late-season canopies, where NDVI can start to level off.
- GNDVI responds more to chlorophyll concentration.
In Texas High Plains studies, NDVI, GNDVI, NDRE, and EVI all tracked cotton yield closely from midseason onward, with R² values of 0.90-0.95. That gives growers more than a simple “thin canopy” signal. It can also point to areas where irrigation response is starting to slip.
Thermal cameras and canopy temperature for irrigation timing
Thermal cameras show where canopy temperature climbs as transpiration drops. Put simply, when plants stop cooling themselves well, they heat up. A thermal map makes that easy to spot, with hot areas standing out across the field.
These maps can also help flag irrigation system issues. Under-irrigated areas may appear as warm streaks or patches. On the flip side, leaks or ponding can look cool because evaporation lowers surface temperature.
Two metrics come up a lot here. CWSI compares canopy temperature to wet and dry baselines. WDI blends thermal and multispectral data, and it tends to work better early in the season, when exposed soil can throw off thermal readings. In Lubbock County, Texas, WDI beat CWSI during early growth stages for that exact reason.
For the clearest read, fly thermal missions near solar noon, when canopy-air temperature differences stand out most. Those hot spots can show where water stress is building now, before it's obvious from the ground.
When multispectral and thermal data work best
Neither sensor does the whole job alone. Multispectral data is better for showing the crop's longer-run condition: how the season has gone so far, where stands are uneven, and which zones are bouncing back. Thermal data is more immediate. It shows which areas are under stress today and whether the irrigation system is putting water where it should.
Together, they show both crop condition and current stress.
| Feature | Multispectral Sensing | Thermal Sensing |
|---|---|---|
| Primary Indicators | Canopy vigor, biomass, chlorophyll activity | Canopy temperature, stomatal conductance |
| Best Use Case | Long-term vigor patterns, stand uniformity | Acute water stress, irrigation timing |
| Data Complexity | Moderate; requires reflectance calibration | High; requires atmospheric/emissivity correction and soil masking |
Using both together, as the WDI approach does, gives a cleaner read by separating heat-driven stress from low biomass and cutting noise from exposed soil. For example, a zone that looks stressed on a thermal map but shows normal NDVI may just be picking up hot soil. But if that same zone shows low NDVI and high canopy temperature, that's a much stronger sign that it needs a closer look on the ground.
The next step is turning these maps into irrigation changes zone by zone.
A drone scouting workflow for cotton irrigation management
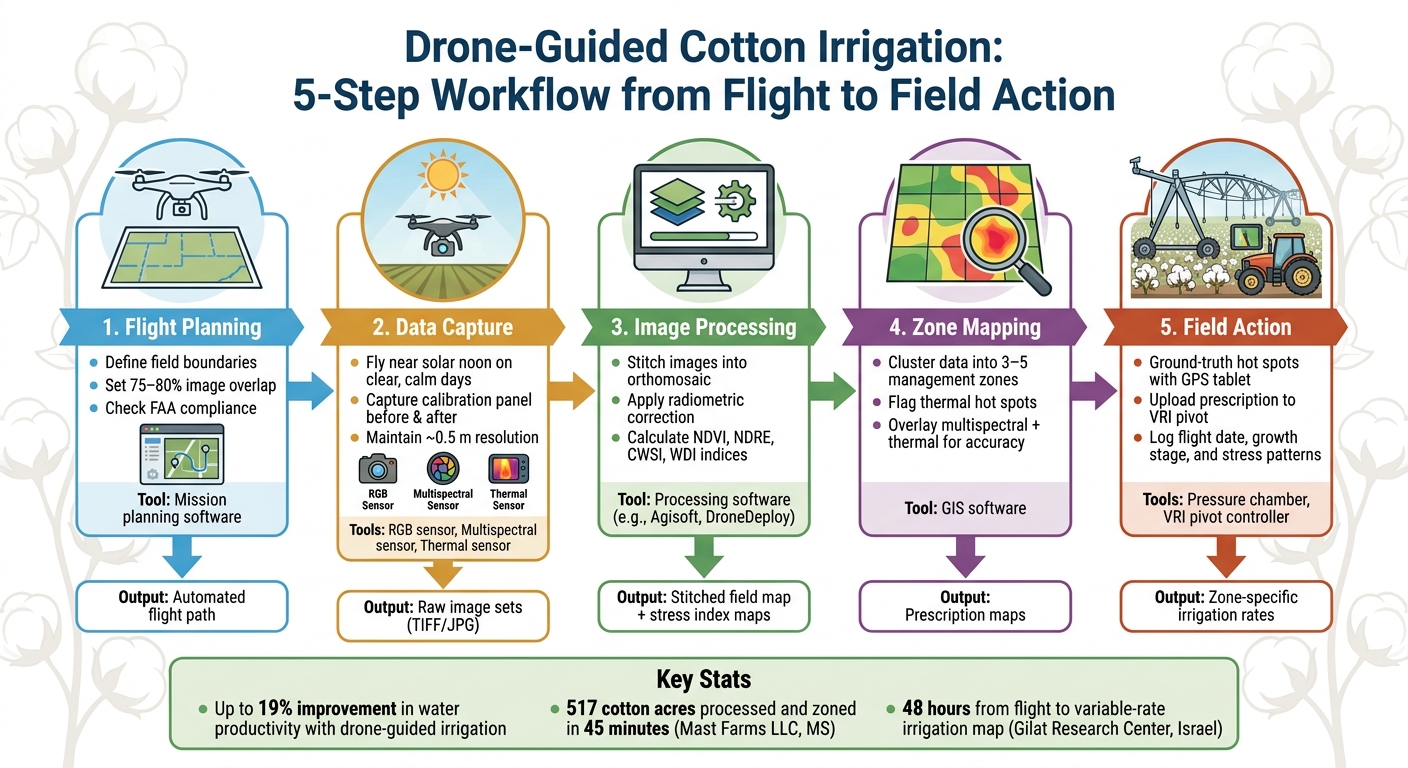
Drone-Guided Cotton Irrigation: 5-Step Workflow from Flight to Field Action
Flight planning, timing, and data capture across cotton acres
Once stress zones show up, the next move is building a workflow you can repeat without reinventing the wheel each time.
Fly on clear, calm days close to solar noon. Keep the flight low enough to hold image resolution near 0.5 m. If resolution gets coarser than 1 m, nearby zones start to blur together. Use RGB to spot stand gaps, multispectral to check vigor, and thermal to find water stress. For multispectral runs, capture a calibration panel before and after each flight.
Plan flights around key cotton growth stages, from seedling through boll opening. Timing matters a lot here. Flying the day before a planned irrigation event, instead of right after one, gives you a cleaner read on plant stress. Otherwise, wet soil can cool the canopy and hide what’s going on.
Turning imagery into maps that show where to act
After collection, processing software stitches the images into an orthomosaic. Then you build index maps - NDVI or NDRE for vigor, and CWSI or WDI for water stress - so field variability is easy to see.
A thermal hot spot can point to a clogged nozzle or a dry patch. When you pair thermal with NDVI, it gets easier to tell water stress apart from nutrient or pest trouble.
Between 2020 and 2021, researchers at the Gilat Research Center in Israel used a DJI S900 UAV with thermal and multispectral sensors to manage a 12.5-ha cotton field. They grouped weekly drone data into management zones using CWSI and NDVI and went from flight to a variable-rate irrigation map in 48 hours.
Those maps only matter if they lead to action in the field.
Using maps to adjust irrigation, labor, and input use
Prescription maps from drone data can be uploaded to variable-rate irrigation (VRI) pivot systems to change application rates across the field. Stressed zones can get more water, while healthier areas get less. That helps avoid rank, overly vegetative growth that can hurt boll development.
Here’s how the workflow connects from start to finish:
| Stage | Main Tasks | Tools/Sensors | Primary Outputs |
|---|---|---|---|
| 1. Flight Planning | Define boundaries, set 75–80% overlap, check FAA compliance | Mission planning software | Automated flight path |
| 2. Data Capture | Midday flight; capture calibration panel | RGB, multispectral, thermal sensors | Raw image sets (TIFF/JPG) |
| 3. Processing | Stitch images, apply radiometric correction, calculate indices | Processing software | Stitched field map, NDVI/CWSI/WDI maps |
| 4. Zonation | Cluster data into 3–5 management zones, flag hot spots | GIS software | Prescription maps |
| 5. Decision/Action | Ground-truth hot spots, upload prescription to pivot or sprayer | Pressure chamber, VRI pivot controller | Zone-specific irrigation rates |
Ground-truth the flagged zones with a GPS-linked tablet. A warm area on a thermal map might be a clogged nozzle just as easily as a dry soil pocket. After that, upload the prescription to the pivot or sprayer. It also helps to keep a log of flight dates, growth stage, and stress patterns so you can compare one pass with the next.
At Mast Farms LLC in Mississippi, 517 cotton acres were flown, processed, and split into zones in 45 minutes, then turned into variable-rate prescriptions for field use.
How well this works still comes down to local soil conditions, heat, and irrigation pressure.
Results, regional fit, and the role of cottongins.org
What growers can gain: less water waste, steadier yields, and better per-acre decisions
This is where drone data starts to pay off. It shows which parts of a field need water now and which parts can wait, so growers aren't watering on guesswork alone.
In trials, drone-guided irrigation management improved water productivity by up to 19%. That can make a big difference in cotton, where water timing often decides whether a field just gets by or performs well.
The yield gap in the Texas High Plains shows why this matters. Fully irrigated cotton can reach about 1.8 tons/ha, while rainfed systems average about 0.6 tons/ha. Drone data helps protect that upside by directing water to the zones that need it most instead of spreading it evenly across the whole field.
There’s also a fiber-quality angle. Precision irrigation can lead to more uniform, mature fibers, along with higher micronaire values and better fiber strength. In plain terms, better water decisions don't just help the crop grow. They can also help the harvested lint come out more even.
| Metric | Traditional Irrigation | Drone-Guided Irrigation |
|---|---|---|
| Water productivity | Baseline | Up to +19% |
| Lint yield (Texas High Plains) | ~0.6 tons/ha (rainfed) | ~1.8 tons/ha (fully irrigated) |
| Fiber quality | Lower maturity and uniformity | Higher strength, micronaire, and uniformity |
How regional conditions shape drone use in U.S. cotton production
Drone use in cotton isn't one-size-fits-all. What works in West Texas may not be the best fit in Georgia or Arkansas. Soil, climate, and irrigation setup all change the job.
In the Texas High Plains, the pressure is obvious. The Ogallala aquifer is depleting, and only about 40% of growers currently factor soil water content into irrigation scheduling. In that setting, UAV canopy cover measurements can replace broad crop coefficients with field-specific estimates of water demand. That helps cut irrigation where it isn't needed.
In the Southeast, rainfall alone doesn't solve the problem. Sandy soils such as Lucy loamy sand can still cause uneven crop growth, even when moisture looks fine on paper. There, multispectral indices like NDVI and GNDVI can flag field variability as early as the squaring stage, around 44 days after planting.
In the Mid-South, drones are often used to spot drainage problems and compaction streaks that disrupt water uniformity. Sometimes the issue isn't how much water a field gets. It's how evenly that water moves through the field.
In the arid Southwest, the focus shifts to heat stress and low moisture. Thermal sensors and CWSI are the main tools for managing those conditions. For large pivot-irrigated farms in the Plains, flights at about 0.5 m resolution offer a workable balance between detection accuracy and processing time.
Conclusion: connecting field-level drone data with the wider cotton network
Drones give growers a clearer view of where stress is building and where the crop is still holding steady. That leads to better irrigation calls, less water wasted on healthy zones, and more even lint quality at harvest.
Once that field data turns into action, it also feeds into the larger cotton ecosystem. That's where cottongins.org comes in: it links growers, gin operators, and ag service providers through listings and submissions that help support local cotton decisions.
FAQs
How often should I fly drones over cotton fields?
Match your flight schedule to the crop’s growth stages. Start with a baseline survey soon after emergence. Then fly every two weeks during squaring and boll development. For precision irrigation, some growers check the data and adjust zones weekly.
Plan flights between 11:00 AM and 2:00 PM local time. That time window gives you more consistent lighting and peak solar loading, which helps you get steady water stress readings like the Crop Water Stress Index.
What drone data best shows water stress in cotton?
Thermal imaging and multispectral data tend to be the most useful here.
Thermal cameras can directly pick up hotter canopy temperatures that happen when transpiration drops. That makes them a strong signal of water stress.
Multispectral imagery, including NDVI, helps track canopy cover, plant vigor, and growth rates tied to water demand. When you use both together, you get a clearer picture and can make more precise irrigation decisions.
Can drones help find irrigation system problems?
Yes. Thermal cameras can spot hotspots caused by uneven watering or clogged emitters, because stressed cotton plants get hotter when transpiration slows down.
When growers pair thermal data with multispectral imagery and 3D elevation maps from LiDAR, drones can also flag spots that are more likely to collect excess water. That gives teams a clear way to catch issues early, fine-tune irrigation, and cut water use by 20% to 30%.