Digital monitoring helps cotton spinning mills reduce stops, keep yarn quality steady, and find production bottlenecks - but only when data leads to action. Start with one problem on one line, test it over 8–12 weeks, and compare results with a baseline before expanding.
Sensors, machine controls, and mill records help teams:
- Find recurring spindle faults and yarn breaks using position-level data and yarn tests.
- Check energy waste and equipment wear using kWh per pound of saleable yarn, vibration, and temperature readings.
- Locate production delays by checking output, queues, material supply, and staffing.
- Turn alerts into verified fixes with accurate readings, secure connections, trained staff, and clear response duties.
The goal isn’t another dashboard. It’s fewer losses, with results checked against plant records and the full cost of the system.
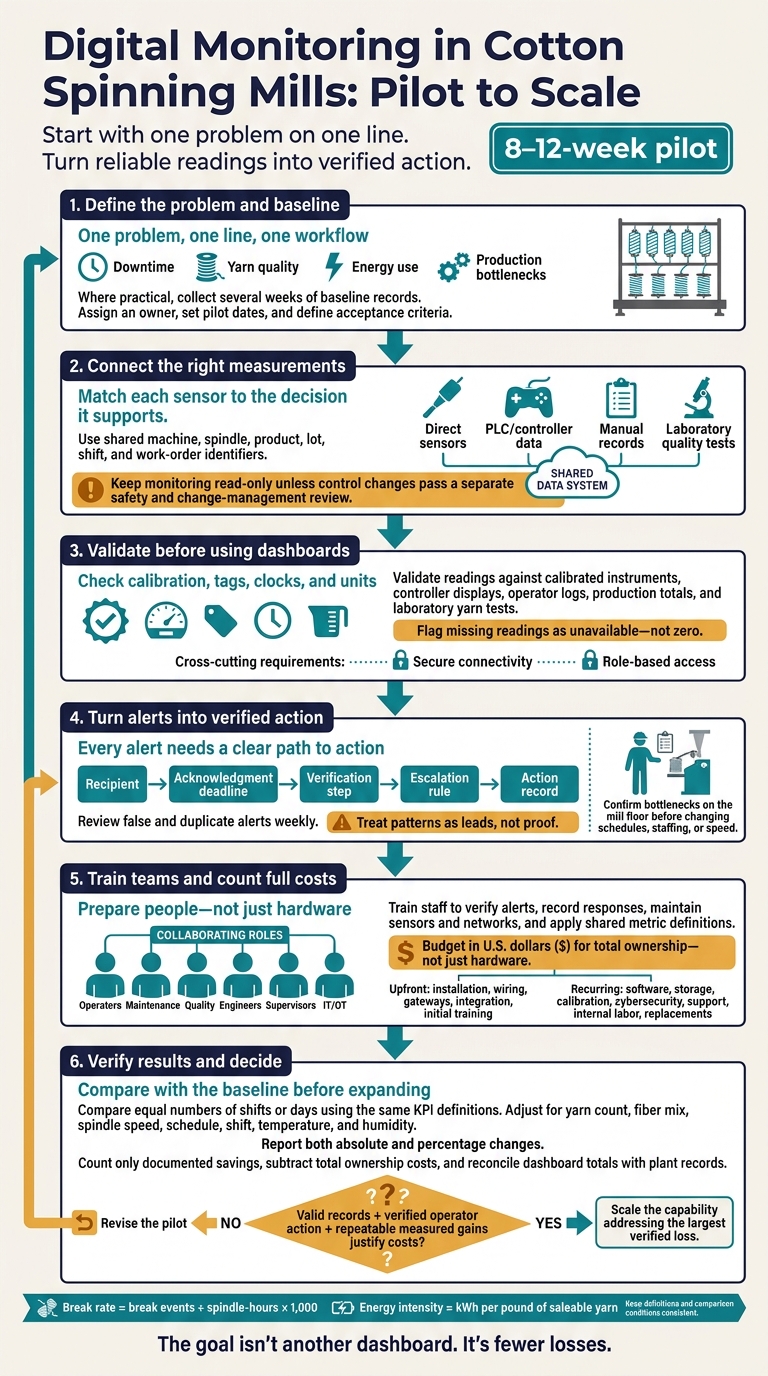
Digital Monitoring in Cotton Spinning Mills: Pilot to Scale
Sensors, Connections, and Data Quality
Once you’ve defined the data flow, choose sensors, connections, and data rules that make dashboards reliable.
Select Sensors and Data Sources
Match each sensor to the decision it supports. A machine-level sensor can’t represent every spindle position. Measure the wrong point, and the dashboard may miss the spindle, quality, or energy issue behind downtime.
Mount vibration and acoustic sensors on bearings, drives, motors, and gearboxes. Measure temperature at motors, bearings, and control cabinets, plus temperature and relative humidity in each production zone. Submeter major loads, including spinning frames, compressors, and HVAC. Before buying hardware, check whether the PLC already provides speed, draft, twist, alarms, and throughput.
| Data source | Accuracy considerations | Update frequency | Installation effort | Typical spinning-mill use |
|---|---|---|---|---|
| Direct sensor | Depends on mounting, calibration, range, and contamination | Milliseconds to minutes | Medium to high: mounting, wiring, power, commissioning | End breaks, vibration, temperature, energy, climate |
| PLC or controller | Verify tags, scaling, and commanded vs. measured values | Milliseconds to seconds | Low with documented access; higher on older equipment | Speed, draft, twist, alarms, state, counts, throughput |
| Manually entered data | Often delayed or inconsistently labeled | Per event, shift, or inspection | Low hardware effort; requires training | Downtime reasons, material changes, maintenance, exceptions |
| Laboratory quality data | Validated samples, not continuous production | Per sample, lot, or test schedule | Sampling procedures and record integration | Count, strength, elongation, evenness, imperfections, hairiness |
Connect Machines and Mill Systems
Before installation, document available ports, protocols, controller permissions, and tag definitions. Use OPC UA where supported, with authenticated SignAndEncrypt connections. Older machines may need retrofit sensors, signal converters, and gateways that timestamp readings and buffer them during outages. Keep monitoring read-only unless control changes pass a separate safety and change-management review.
Survey wired and wireless coverage across the mill, including areas with metal frames, high motor noise, dust, humidity, and moving equipment. Protect devices from dust, heat, vibration, and electrical noise. Route cables away from cleaning, doffing, and maintenance access.
Store readings in a time-series database with acquisition time, ingestion time, source, machine/spindle ID, tag, value, unit, quality flag, and configuration version. Keep raw records separate from cleaned and calculated values. Connect planning, maintenance, laboratory, and energy systems through shared machine, spindle, product, lot, shift, and work-order identifiers.
Separate operational technology from office networks, restrict access by role, and remove default credentials. Maintain patch and certificate procedures. Set retention periods, back up data and configurations, and test restoration.
Connections alone aren’t enough. The readings also need calibration and validation before operators can rely on them.
Check Data Before Using Dashboards
Clean data helps teams reduce breaks, keep quality steady, and spot bottlenecks faster.
Calibrate sensors at commissioning and schedule drift checks. Validate readings against calibrated instruments, controller displays, operator logs, production totals, and laboratory yarn tests. Synchronize clocks across devices, gateways, servers, and laboratory systems.
Maintain a tag dictionary with consistent machine and spindle identifiers, ranges, sampling intervals, calibration requirements, and units. Poor tags and mismatched clocks can make dashboard trends misleading. Use pounds and °F in U.S. dashboards, but retain kilograms, °C, tex, denier, and other required textile units in specifications.
Define stopped, idle, fault, setup, and no-material states separately. Flag missing readings as unavailable - not zero. Detect duplicates using source and event identifiers, timestamps, and sequence numbers. Preserve acquisition times for delayed records, and define how late or out-of-order events trigger corrections.
Give each team clear responsibility: production owns KPI definitions; maintenance owns calibration and alarms; automation owns PLC tags and interfaces; IT/OT owns security and recovery; and the laboratory owns test methods. Assign a data steward to manage identifiers and change control.
Every dashboard should show its formula, time window, exclusions, data-completeness rule, and revision date. Apply least-privilege access, and use audit logs to record who changed a tag, definition, permission, calibration record, or dashboard calculation.
sbb-itb-0e617ca
Use Monitoring to Solve Production Problems
Once timestamps and tags are clean, use the readings to make production decisions: reduce downtime, keep yarn quality steady, and find bottlenecks.
Start with the decision, not the dashboard. Operators need to know which spindle to inspect, which load to investigate, and where production is waiting. Show the current condition, the gap from baseline, who should act, and the next step.
| Monitoring area | Required data | Supported decision | Expected benefit | Main limitation |
|---|---|---|---|---|
| Spindle performance | Position, spindle ID, speed, running state, doffs, stoppages, alarms | Inspect, clean, adjust, or repair a specific spindle or section | Faster fault location | Requires reliable position-level sensing |
| Yarn breaks | Break events, spindle-hours, product, humidity, lot, shift, yarn tests | Investigate mechanical, drafting, traveler, roving, or climate issues | Fewer recurring breaks; steadier quality | Correlation does not establish cause |
| Energy use | Submetered kWh, saleable yarn weight, machine state, product, utilization, shift | Investigate abnormal loads or operating practices | Potentially lower energy intensity | Shared loads can complicate attribution |
| Equipment condition | Vibration, temperature, acoustic signals, motor current, lubrication records, alarms | Prioritize inspection or maintenance | Potentially less unplanned downtime | Detectable warning signs vary by failure mode |
| Bottlenecks | Planned and actual output, availability, queues, doff losses, changeovers, quality holds, staffing, downstream capacity | Change sequencing or resource allocation | Less waiting; better production flow | Floor checks must confirm the constraint |
Track Spindle Performance and Yarn Breaks
Separate natural end breaks from startup breaks, piecing failures, and breaks after doffing. Calculate break rate = break events ÷ spindle-hours × 1,000, and use the same definition of running time throughout.
Flag individual spindles with slippage or repeated faults, along with weak sections. Frame averages can hide these problems. Compare positions by speed, twist, humidity, lot, shift, and maintenance history. Local patterns call for mechanical, drafting, and traveler checks. Changes across many positions point toward speed, humidity, material, or operating practices. Treat patterns as leads, not proof.
At Ahmed Fine Textile Mills, quality-control and engineering teams reviewed Uster Sentinel reports twice during each 8-hour shift and passed findings to maintenance. The published case reported startup-break spindles falling from 5% to 1%, repeated rogue spindles falling from 95 to 25 per shift, and bobbin-build-related yarn breakage from 5.8% to 2.2%. These are site-specific results, not guaranteed improvements; mills should establish their own baseline and report confidence intervals, measurement periods, product mix, utilization, and data completeness.
Cut Energy Waste and Equipment Downtime
Use submetered load data to rank abnormal energy use by product, utilization, and shift. Compare kWh per pound of saleable yarn, accounting for downtime and room conditions before calling a load inefficient.
To assess equipment wear, combine vibration, temperature, acoustic signals, motor current, lubrication records, and alarms. Use those readings to decide what needs physical inspection first. A rising trend calls for a check - not an automatic failure diagnosis or replacement.
| Maintenance approach | Action trigger | Data needs | Main limitation |
|---|---|---|---|
| Reactive | Failure, stoppage, or alarm | Fault and work-order records | Unplanned downtime and possible secondary damage |
| Preventive | Calendar interval, operating hours, or doff count | Service schedule, runtime, doff count, maintenance history | Can replace usable parts or miss failures between services |
| Condition-based | Threshold crossing or worsening trend | Calibrated sensors, baselines, alarm limits, inspection records | Requires reliable thresholds and trained interpretation |
| Predictive | Estimated failure risk or remaining useful life | Historical sensor data, labeled failures, operating context, validated models | Accuracy, false alarms, missed failures, and warning time need equipment-specific validation |
Find Production Bottlenecks
Compare planned and actual output alongside availability, queues, doff losses, changeovers, quality holds, and downstream capacity. Trace the flow through spinning and winding. A stopped frame may be waiting for roving, while a queue may come from a quality hold rather than a lack of capacity.
Check spindle faults, staffing, maintenance delays, and material availability. Supervisors must confirm the constraint on the mill floor before changing schedules, moving staff, or increasing speed. Faster spinning won't clear a downstream hold and may hurt yarn quality.
Start the pilot with one high-value problem area. Test the workflow and show that it works before expanding it.
Start With a Focused Monitoring Pilot
Check Readiness and Choose One Problem
Start with one problem, one line, and one workflow. Test whether monitoring can reduce downtime, improve yarn quality, or ease a bottleneck before scaling.
Check machine condition, controls, sensor access, network coverage and uptime, power, operating conditions, support, staff skills, budget, and cybersecurity ownership. Build interoperability, data quality, and security into the design from the start. This check sets the limits of what the pilot can measure and control.
Review current production, maintenance, quality, and energy reports. Where practical, collect several weeks of baseline records. Then choose a problem you can measure within 8–12 weeks, assign an owner, and set pilot dates. Define acceptance criteria for valid records, alert response, staff action, and measured improvement. Keep comparisons consistent across products, shifts, materials, and staffing.
Test the Pilot and Set Alert Procedures
With the scope set, define the data rules and alert workflow. Standardize IDs and timestamps before testing thresholds. Check readings against machine counters, operator logs, and calibrated instruments.
Give operators immediate checks to perform, maintenance teams fault and sensor-health histories, and supervisors summaries of unresolved events.
Every alert needs a clear path to action: a recipient, an acknowledgment deadline, a verification step, an escalation rule, and an action record. Test sensor loss, power loss, incorrect timestamps, and delayed syncing. Confirm that equipment can operate safely offline. Review false and duplicate alerts weekly, and suppress duplicate notifications.
Train Staff Before Expanding
Once the pilot runs reliably, train each team for its role. Operators need to verify alerts and record responses. Technicians need to maintain sensors and networks. Quality teams need to connect trends with yarn tests, while engineers manage tags, calculations, and models.
Supervisors should update procedures, and managers should standardize metric definitions. Train all staff on basic cybersecurity; don't assume specialists will cover every need.
Budget in U.S. dollars ($) for total ownership - not just hardware. Separate upfront costs for installation, wiring, gateways, integration, and initial training from recurring costs for software, storage, calibration, cybersecurity, support, internal labor, and replacements.
If alerts create too much manual work or lead to no useful action, revise the pilot. Expand only when valid records, verified operator action, and measured gains in mill performance justify the costs.
Conclusion: Review Results and Plan Next Steps
After the pilot, compare results with the baseline to decide whether the mill is ready to scale.
Compare Results With the Baseline
Use the same definitions for utilization, end-break rate, availability, MTBF, MTTR, output, first-pass quality, energy intensity, bottleneck duration, and alert response time in both the pilot and baseline.
Compare equal numbers of shifts or days. Adjust for yarn count, fiber mix, spindle speed, schedule, shift, temperature, and humidity, then report both absolute and percentage changes. Count only documented savings and subtract the total cost of ownership. Before expanding, resolve any differences between dashboard totals and plant records.
Choose the Next Investment
Scale the capability that addresses the largest verified loss from downtime, yarn quality, energy use, or production bottlenecks. Reliable measurements, clear response procedures, trained staff, and a tested pilot matter more than another dashboard.
Match the next investment to the decision the mill needs to make, not the newest tool.
| Approach | Data capability | Typical decisions | Prerequisites | Main risk |
|---|---|---|---|---|
| Manual reporting | Periodic staff entries | Review output, breaks, downtime, and energy by shift | Standard forms, shared KPI definitions, consistent entries | Delayed or incomplete information |
| Connected monitoring | Near-real-time machine and process data | Respond to stops, energy peaks, and quality deviations | Sensors or interfaces, reliable connectivity, synchronized clocks, validated tags | False alarms or misleading dashboards |
| Diagnostic analytics | Linked production, quality, energy, and maintenance records | Investigate losses, confirm bottlenecks, and prioritize corrective action | Clean history, integrated systems, analytical skills, operating rules | Correlation mistaken for causation |
| Predictive operations | Models estimate failure, quality, or energy risks and support planned action | Schedule maintenance and prevent likely disruptions | Sufficient history, validated models, accountable workflows, trained staff | Model drift or ineffective interventions |
Use a stage-gate decision after the pilot, checking each item before moving ahead:
- [ ] Establish comparable baseline periods and shared KPI definitions.
- [ ] Verify sensor calibration, connectivity, timestamps, units, and machine tags.
- [ ] Assign alert owners, response times, and escalation paths.
- [ ] Train operators, maintenance staff, supervisors, and relevant IT personnel.
- [ ] Check that outcomes can be repeated, and validate them against records and total costs.
- [ ] Choose the next application based on verified losses, not technology novelty.
FAQs
Can I monitor older spinning machines without replacing them?
Yes. Adding sensors to older spinning machines lets operators track temperature, vibration, and machine load in real time. These sensors feed data into centralized systems, helping operators spot early signs of wear, imbalance, or possible failures before they lead to unplanned downtime.
Advanced automation may require major adjustments or infrastructure upgrades. But basic digital monitoring with IoT sensors offers a practical way to bring Industry 4.0 capabilities to existing equipment.
How can I separate monitoring gains from normal production changes?
Use centralized dashboards to compare real-time metrics with historical benchmarks. Track Overall Productivity (OPS) or the Composite Productivity Index (CPI) to bring machine, labor, and energy data together and spot performance trends.
Review stoppage-cause logs and energy usage to separate expected shifts - such as fiber blend changes or routine settings - from sensor-detected anomalies. This replaces guesswork with measurable assessments of how production is running.
When is my mill ready for predictive maintenance?
Your mill is ready for predictive maintenance when it has a structured preventive maintenance program and is prepared to add digital monitoring tools.
Check whether your infrastructure can support real-time vibration and temperature sensors. Identify which equipment would gain the most from automation, and train staff to analyze the data.
Implement an Enterprise Asset Management (EAM) system or a similar digital platform to replace manual, reactive recordkeeping with data that helps guide maintenance decisions.