If I can see yield, moisture, module location, and machine progress during harvest, I can make same-day calls that affect the next truck, the next field, and next year’s input plan.
This article comes down to a simple idea: cotton yield monitoring turns each pass through the field into mapped harvest data. I can use that data to spot low-yield areas, watch module flow, check moisture in the 9% to 13% range, and line up gin deliveries with fewer guesses. It also shows why calibration matters, why cloud tools help when several pickers are running, and how module IDs tie each load back to the exact field location.
Here’s the short version:
- I use mass flow sensors + GPS + display logs to map yield by acre.
- I check calibration before harvest and when crop conditions shift.
- I use live dashboards to watch acres finished, picker location, and fuel.
- I pair yield with moisture, module IDs, and gin records to trace field results back to exact zones.
- I use those records to plan field order, labor, trucking, and gin timing.
A few hard facts stand out:
- Up to six harvesters can share coverage maps in the field through connected systems.
- If monitor totals differ from scale tickets by more than 50%, the data needs to be checked before weights are entered.
- Moisture sensors are used most effectively in the 9%–13% band for harvest timing and fiber protection.
Quick Comparison
| System Type | What I See | Main Use |
|---|---|---|
| Local monitor logs | In-cab harvest records only | Basic field tracking during harvest |
| Cloud-connected telemetry | Near real-time machine and harvest data across devices | Multi-picker oversight, routing, and scheduling |
| Yield-only setup | Yield maps and field totals | Spotting low- and high-producing areas |
| Yield + moisture + module + gin data | Yield, moisture, module ID, GPS, and delivery records | Harvest timing, quality tracing, and gin planning |
So if I want to get more from every acre, I don’t just need a yield map. I need clean calibration, live machine data, module tracking, and records I can use after harvest without sorting through a mess.
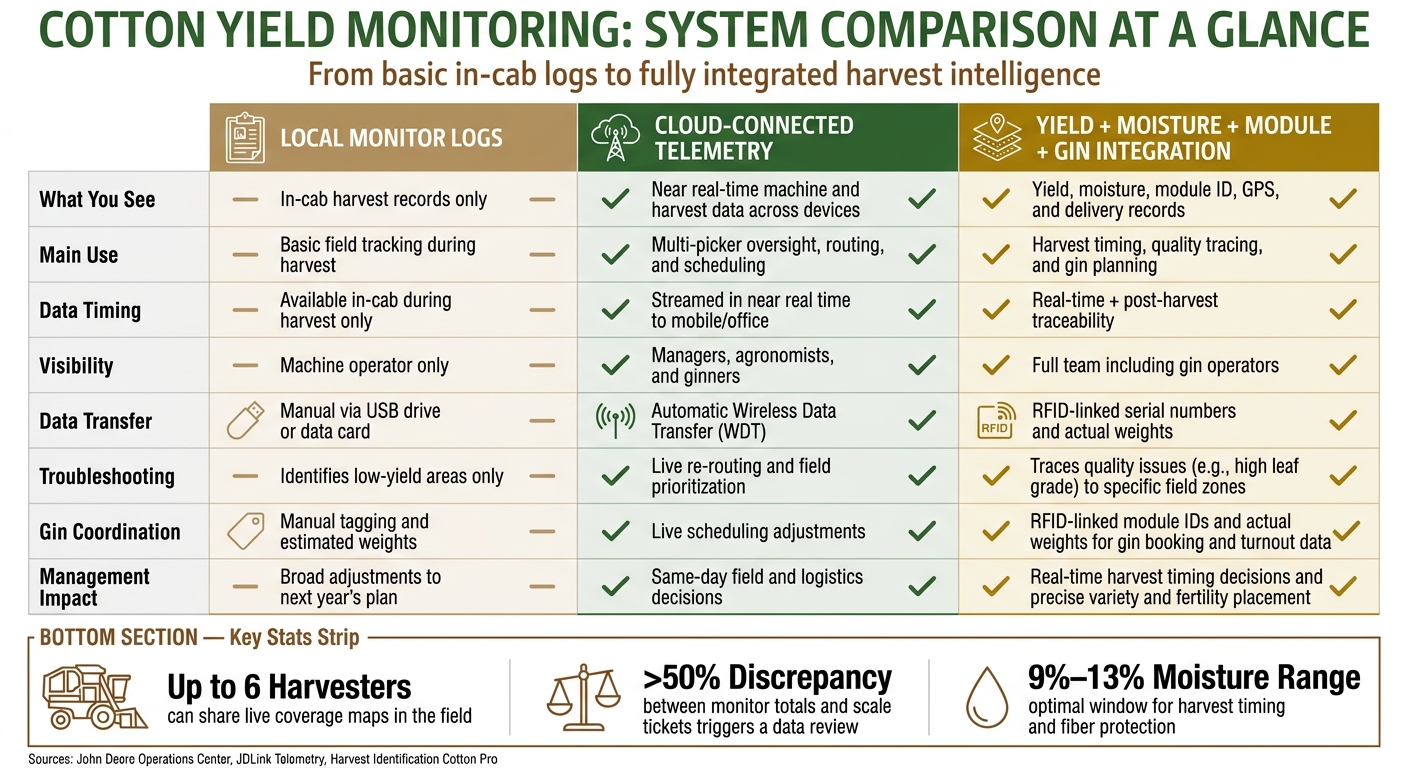
Cotton Yield Monitoring: Local Logs vs. Cloud Telemetry vs. Full Integration
CP770 & CS770 Cotton Harvesters - Calibrations for Yield Data | John Deere Operations Center™
sbb-itb-0e617ca
How Cotton Yield Monitoring Systems Collect Field Data
That acre-level view starts with machine data capture. As the picker moves through the field, the hardware turns each pass into a yield record tied to a precise spot on the map.
Onboard Picker Sensors, Flow Measurement, and GPS Positioning
A calibrated mass flow sensor measures seed cotton weight. At the same time, a GPS receiver such as John Deere's StarFire™ records the exact latitude and longitude of each pass. An application controller, such as the John Deere 1120, then packages those inputs into harvest files.
On module-tracking pickers and strippers, an RFID reader scans the module wrap tag. That scan links each module to its field location and production data. Cab displays such as the GreenStar™ 3 2630 or Gen 4 4640 log harvest data and support USB or wireless transfer. Resettable counters in the cab track module totals by field or season.
| Component | Role in Data Collection |
|---|---|
| Application Controller | Combines GPS position, variety, and machine ID into harvest files |
| GPS Receiver | Provides spatial coordinates for acre-by-acre mapping |
| RFID Reader | Automatically captures module serial numbers from wrap tags |
| Machine Display | Facilitates data transfer to the gin or management software |
Calibration and Data Quality: What to Check Before Trusting Your Maps
Calibration is what makes the map worth using. If calibration is off, the map is off too, and that can lead to poor zone decisions when you're trying to get more from every acre. Yield accuracy can shift with variety, moisture, defoliation, and weed pressure, so it's smart to check calibration any time field conditions change.
"Mass flow sensors must be calibrated in order to achieve accurate cotton weights. Calibration should be performed when necessary as condition and maturity of crop change or at least once a season." - John Deere
Before harvest starts, make sure every component is installed the right way and that sensors are clear. If you've just installed the system or changed sensors, run row compensation in a uniform area before harvest. For the best in-field accuracy, use Standard Calibration with actual scale weights from a boll buggy or module weight. If you don't have a scale, Quick Calibration can work as a backup, but the accuracy will be lower.
One thing to avoid: changing the calibration factor in the middle of a field. Doing that creates uneven spatial data inside a single yield map.
The most accurate final yield maps often come from post-harvest calibration. This process uses desktop software after harvest to match monitor logs with total field weights or individual module weights. If monitor totals differ from scale tickets by more than 50%, check for sensor or load errors before entering weights.
Once calibration is dialed in, those records can feed live maps and harvest dashboards.
From Harvest Data to Live Maps and Dashboards
Once calibration is dialed in, every pass turns into a live yield record. And that record gets a lot more useful when it flows into harvest software and module tracking.
Yield Maps That Identify Low- and High-Performing Zones
A yield map shows field performance by color. High-yield and low-yield areas stand out in different shades, and that pattern on the map can point you to places worth checking later.
Telemetry Dashboards for Live Harvest Progress and Machine Oversight
Cloud-connected systems like JDLink let managers track harvest progress in real time. A farm manager can open a mobile dashboard and see acres completed, machine location, and fuel levels across every picker running that day.
There’s a simple upside here: up to six harvesters can share coverage maps with each other in the field. That makes it easier for operators to line up their paths without overlapping or missing strips. Less overlap. Fewer gaps.
Local Monitor Logs vs. Cloud-Connected Telemetry: A Side-by-Side Comparison
Both options record yield data. The big difference is who can use that data, and how fast they can use it. Here’s the side-by-side view for farms weighing how much live visibility they want during harvest.
| Feature | Local Monitor Logs | Cloud-Connected Telemetry |
|---|---|---|
| Data Timing | Available in-cab during harvest only | Streamed in near real time to mobile/office |
| Visibility | Limited to the machine operator | Accessible by managers, agronomists, and ginners |
| Data Transfer | Manual via USB drive or data card | Automatic Wireless Data Transfer (WDT) |
| Connectivity | No external connection required | Requires JDLink/cellular signal |
If cell coverage is spotty, local logs can still do the job. But for larger farms running several pickers across multiple fields, cloud telemetry gives you a clear edge. You can re-route module trucks, shift attention to fields based on live moisture and weight data, or line up gin scheduling without waiting until the end of the day.
Those live records get even more useful when you pair them with moisture, module, and software data.
Using Software and Integrated Data to Improve Yield and Profitability
Monitor logs only go so far on their own. The value shows up when you connect them to field records, zone maps, and input history. Then software can turn that pile of harvest data into field-by-field decisions that people can actually use.
John Deere Operations Center, Climate FieldView, and Ag Leader: How Each Handles Cotton Yield Data
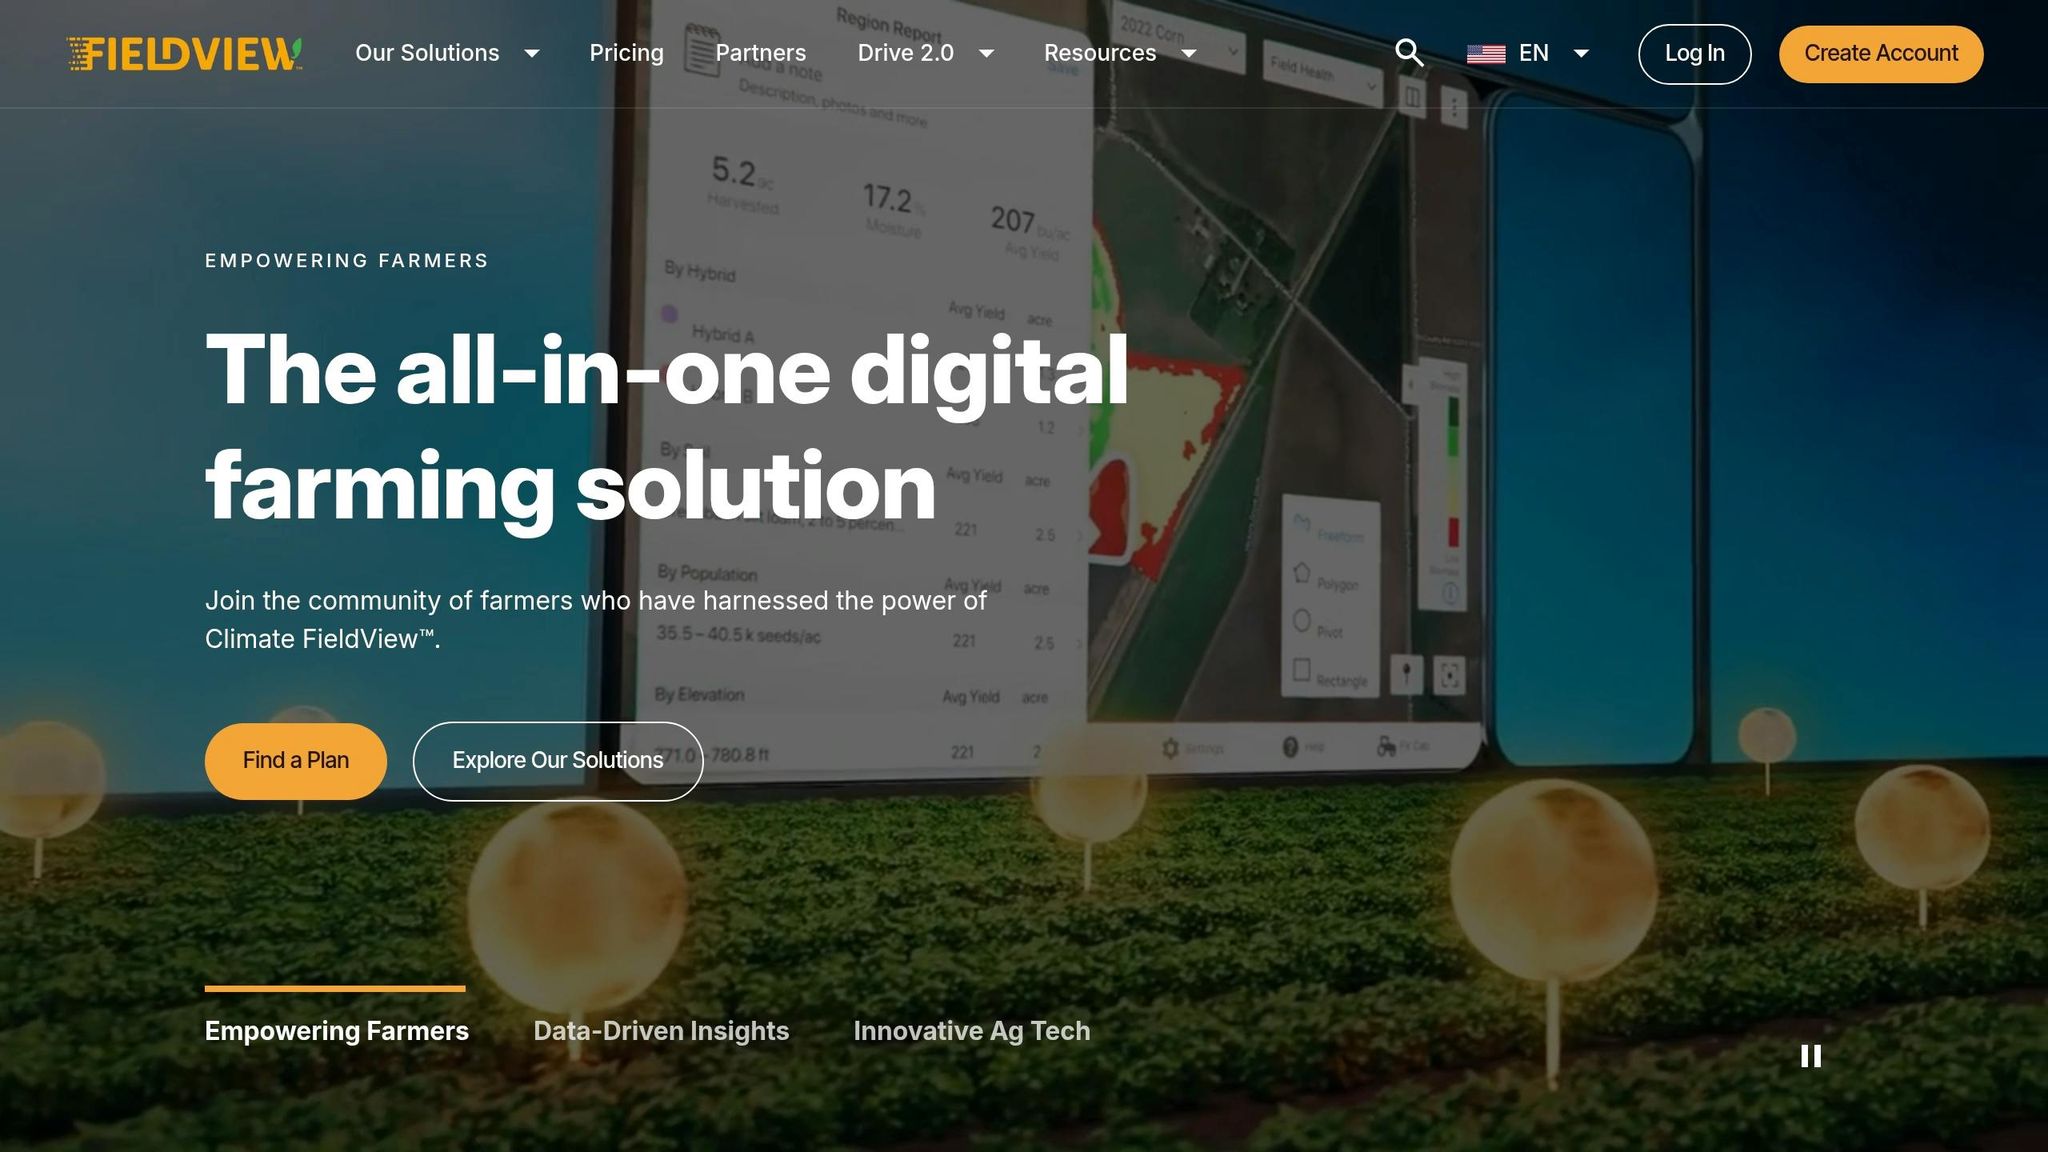
John Deere Operations Center’s Field Analyzer shows module creation locations right on yield maps, and it keeps data sorted by Client, Farm, and Field. That setup makes it easier to isolate performance by production area and compare it with what was applied there. The Operations Center Mobile app brings that same view to managers and agronomists during harvest, so the team can stay synced on field-by-field progress.
Climate FieldView works in a similar way when yield maps are layered with application records and management zones. On their own, yield maps tell part of the story. Pair them with application records and fiber-quality results, and the picture gets much sharper. Ag Leader systems add another layer by monitoring every air duct on a picker to produce high-resolution yield data. That gives growers a closer look at within-field variation. Put together, these platforms help tie applied inputs straight to yield results and show where changes are most likely to pay off.
How Moisture Records, Module Tracking, and Gin Data Add Planning Value
Moisture adds something yield maps can’t: timing.
John Deere’s Harvest Identification, Cotton Pro system automatically records each module’s serial number, moisture level, weight, and GPS coordinates at wrap and drop locations. That record links the module back to the field zone that produced it. If a load comes back with high leaf grades or poor fiber quality, it becomes much easier to trace that issue to a certain defoliation pass or application choice.
Sensors accurate in the 9–13% moisture range help operators make real-time calls on when to start or stop picking to protect fiber quality. If modules come in above that range, they need to get to the gin sooner. And for gins without their own scales, the weights logged by the harvester supply turnout data that the operation still needs.
You can see the gap pretty clearly when basic yield tracking is stacked up against yield data tied to moisture and module records.
Yield-Only Monitoring vs. Yield Plus Moisture and Gin Integration: A Side-by-Side Comparison
| Feature | Yield-Only Monitoring | Yield Plus Moisture & Gin Integration |
|---|---|---|
| Data Visibility and Planning Value | Basic yield maps, field totals, and general field-level performance | Per-module weight, moisture, and GPS at wrap and drop locations; correlates inputs to fiber quality |
| Troubleshooting | Identifies low-yield areas only | Traces quality issues, such as high leaf grade, to specific defoliation or input zones |
| Gin Coordination | Manual tagging and estimated weights | RFID-linked serial numbers and actual weights for gin booking and turnout data |
| Management Impact | Broad adjustments to next year's plan | Real-time harvest timing decisions and precise variety and fertility placement |
RFID tags give each module its own ID. That means crop traits can be traced back to the exact acre where they were produced, which helps guide variety choice and later fertility or chemical decisions.
Turning Yield Data Into Better Harvest and Gin Decisions
How to Use Yield Data to Prioritize Fields, Labor, and Input Follow-Up
Once harvest data is mapped and synced, put it to work the same day. Use live yield gaps to decide where crews go, when to shift equipment, and which fields should move to the top of the harvest list.
Repeat low-yield strips matter even more. They give you a clear place to focus follow-up work, whether that's scouting, soil work, or input changes for next season. Instead of treating the whole field the same, you can zero in on the spots that keep falling behind.
Resettable module counters help keep the day from getting messy. Use one counter for field completion and another for seasonal totals so trucks stay on track and gin schedules don't drift.
Planning Module Movement and Gin Coordination with cottongins.org
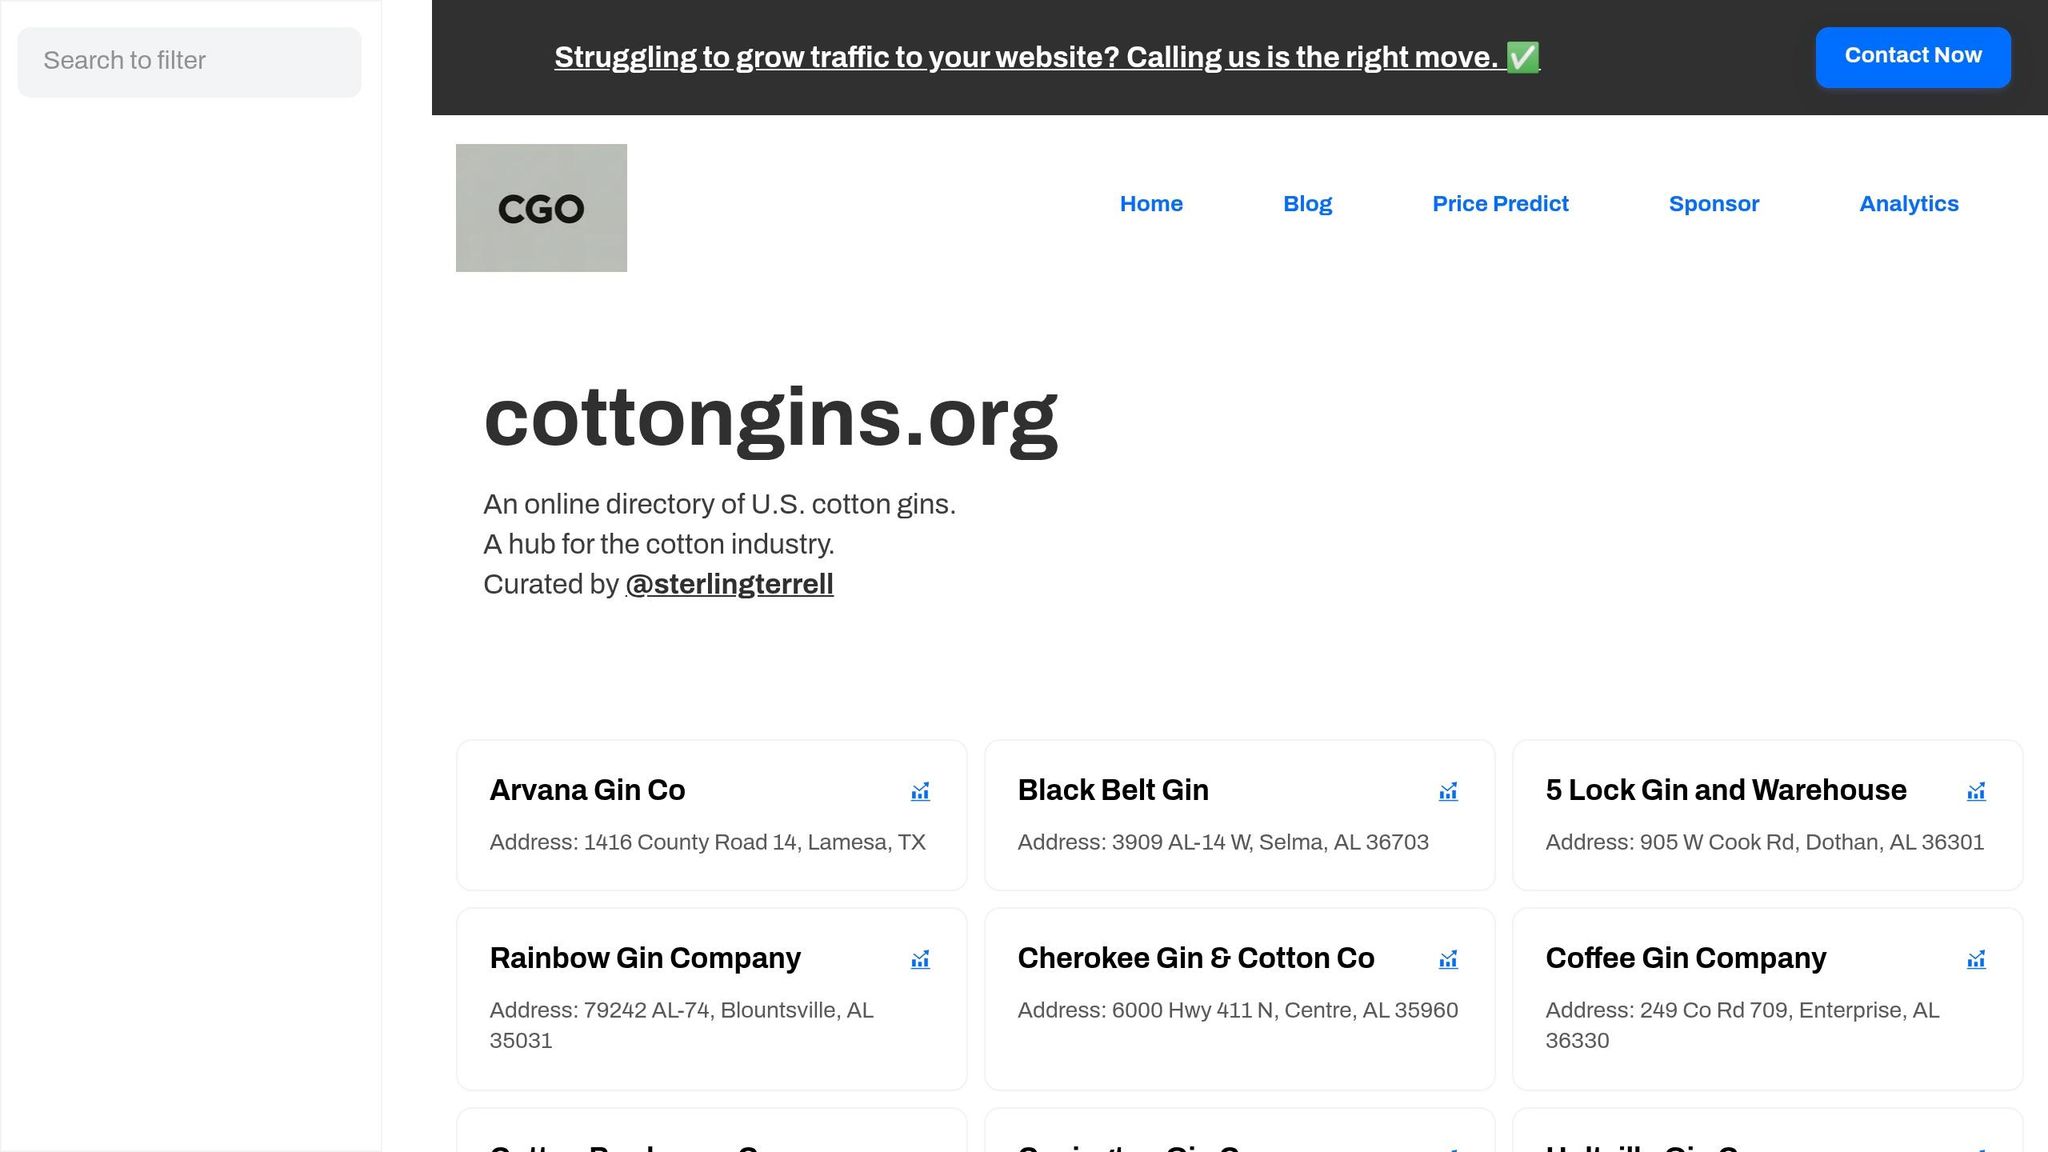
Once yield is tracked, the next step is module movement and gin intake. Export module data with GPS location, serial number, variety, farm ID, and timestamp at wrap. From there, the file can move into the operations system and then into the gin's scheduling workflow.
Earlier visibility into scheduling gives gins more room to group similar varieties and manage queue timing based on expected volume. Use cottongins.org to find the nearest gin by state and county. That can cut empty truck miles and tighten routes and delivery timing.
Conclusion: The Core Technology Stack for Maximizing Every Acre
Yield monitoring does its best work when it connects field performance with harvest movement, module tracking, and gin scheduling. Onboard sensors, GPS/GIS mapping, telemetry, software, and moisture-module-gin data all work together to turn harvest records into faster, sharper decisions.
That kind of visibility helps growers protect yield, control cost, and move every acre through harvest on time.
FAQs
How accurate are cotton yield monitors?
Cotton yield monitors can be highly accurate when they’re calibrated the right way. That makes them a solid tool for mapping field-to-field and within-field yield differences, which helps guide day-to-day and season-long management choices.
Accuracy doesn’t just happen on its own, though. You need to calibrate sensors on a regular basis, keep parts like spindles in good shape, and filter out outlier readings that come from speed swings. When you stay on top of those steps, the data can pinpoint low-performing zones with precision and help track long-term productivity.
What needs calibrating before harvest?
Before harvest, calibrate the mass flow sensors on your cotton picker so your yield data is accurate. Plan to do this at least once each season. You should also recalibrate when field conditions shift, like changes in variety, moisture, or harvest quality.
Before you start, make sure the harvester basket, accumulator, and bale chamber are empty. For the best results, use a Standard Calibration with actual scale weights. If that’s not possible, you can use a Quick or manual calibration instead.
How does module tracking help gin planning?
Module tracking gives gin operators an early, accurate read on harvest volume and fiber flow. By using unique identifiers like RFID tags, teams can follow modules from the sub-field all the way to the gin.
That live data makes day-to-day planning much easier. Operators can line up logistics and scheduling, fine-tune intake timing, adjust staffing, and map hauling routes based on projected volumes and moisture levels. The payoff is simple: fewer bottlenecks and steadier throughput.