Yes, automation can pay off in a U.S. cotton gin - but only when I aim it at the costliest bottleneck first. In the examples here, payback often lands in 1 to 3 seasons, with the strongest returns coming from bale handling, moisture control, contamination detection, and software that cuts manual tracking work.
Here’s the short version:
- Bale handling automation cuts end-of-line labor and can move output from about 50 to 60+ bales per hour
- Moisture control can trim drying cost by about $1 per bale and add about $21 per bale in fiber value
- Contamination detection can cut defect bales, lower claims, and add 2,000 to 5,000 bales of seasonal throughput in some mid-size gins
- Data-tracking software can save 3 to 4 hours a day of manual entry, with around $40,000 per year in labor savings in one case
One stat sets the tone: total ginning cost per bale went from $23.93 in 2019 to $49.31 in 2022. That kind of cost jump changes the math fast.
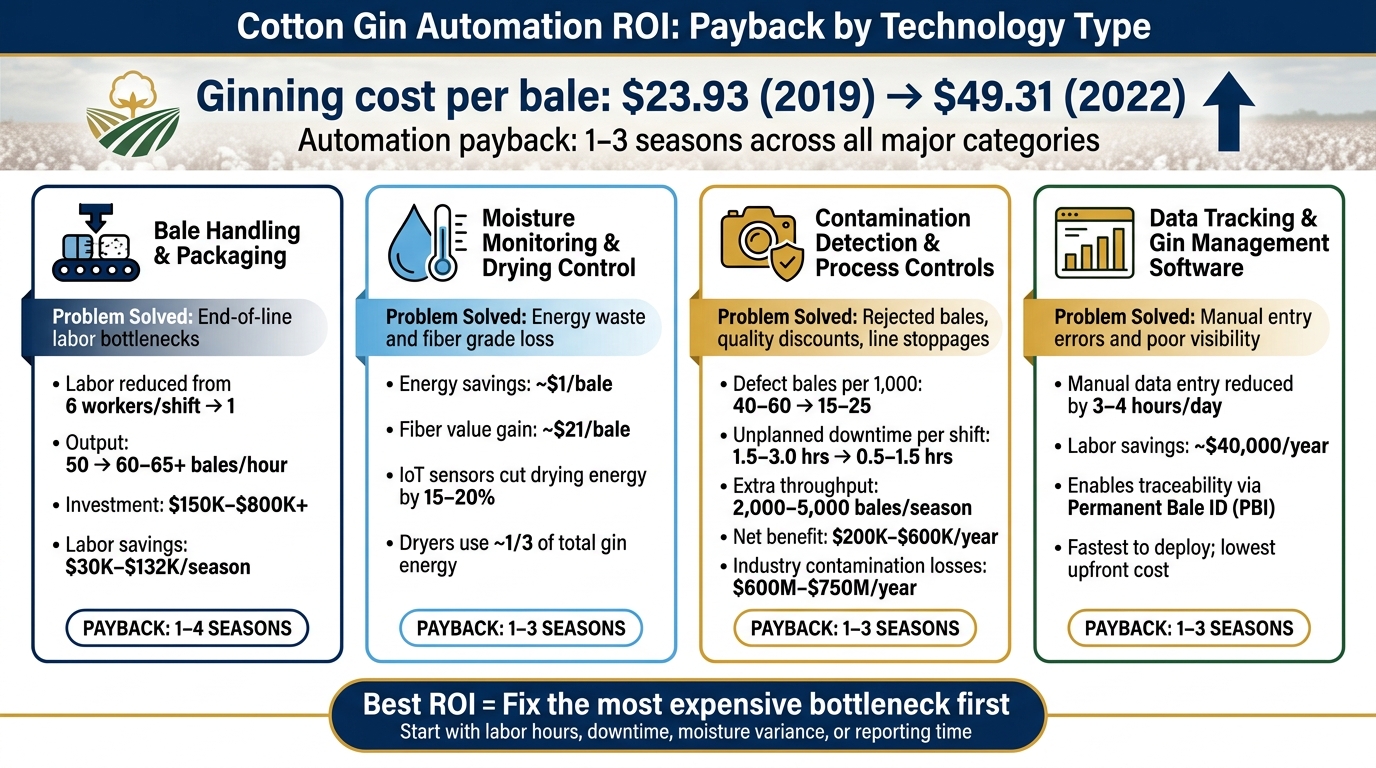
Cotton Gin Automation ROI: Payback by Technology Type
Quick Comparison
| Automation type | Main problem fixed | Main source of return | Typical payback |
|---|---|---|---|
| Bale handling and packaging | End-of-line labor and line backups | Fewer workers, more bales per hour | 1–4 seasons |
| Moisture monitoring and drying control | Fuel waste and overdrying | Lower energy use, better fiber value | 1–3 seasons |
| Contamination detection and process controls | Claims, rejects, stoppages | Fewer discounts, less downtime, more throughput | 1–3 seasons |
| Data tracking software | Manual records and weak traceability | Labor savings, faster reporting, better visibility | 1–3 seasons |
If I had to sum up the full article in one line, it would be this: the best ROI comes from fixing the part of the gin that costs the most money every shift.
sbb-itb-0e617ca
Case Study Group 1: Automated Bale Handling and Packaging
Before Automation: Manual Packaging and End-of-Line Delays
Bale handling is often the first place gins automate because it removes the labor that most often slows the whole operation.
Before automation, bale handling often set the ceiling on throughput and usually needed 3–6 workers per shift for bagging, strapping, tagging, and bale movement. The choke point was the end-of-line crew.
Manual bagging meant workers had to pull bags over heavy bales by hand. Hand-strapping added more delay because workers had to thread, tension, and cut straps or wires while the line kept moving. If tagging or bagging slipped behind, forklifts hauling finished bales to storage could stack up too. Once that happened, the whole discharge point slowed down.
For many medium-size gins, that meant hitting a wall at around 45–55 bales per hour, even when the rest of the line could have gone faster. The safety side was no small issue either. Workers were around moving press platens, strapping tools under tension, and constant pedestrian-forklift traffic. That mix led to repeated near-misses and plenty of ergonomic strain.
Project Costs, Labor Reduction, and Payback Periods
At United Farm Industries in Plainview, Texas, Samuel Strapping Systems' Jenglož Model 90 reduced final packaging labor from six workers per shift to one and handled up to 55 bales per hour, with a design target above 75.
Modern high-speed bale tying systems have moved output even higher. The P600 Bale Tying System has shown production of up to 61 bales per hour, with a theoretical ceiling of about 65 bales per hour when paired with a compatible high-capacity press. It also improved bale size consistency and cut worker safety exposure.
The table below pulls together the documented case-study ranges.
| Gin Profile | Equipment Installed | Project Cost | Labor Savings/Season | Bales/Hour | Payback |
|---|---|---|---|---|---|
| Small gin (~under 20,000–25,000 bales/season) | Automatic strap applicator + short conveyor | $150,000–$300,000 | $30,000–$70,000 | Incremental; mainly labor-driven | 1–2 seasons |
| Mid-size gin (~25,000–60,000 bales/season) | Automatic bagger + strap applicator + conveyors | $400,000–$600,000 | $75,000–$132,000 | Often 50→60–65 | 2–3 seasons |
| Large gin (60,000–80,000+ bales/season) | Fully integrated bale line with PLC controls | $500,000–$800,000+ | $80,000–$120,000+ | Often 70→85+ | 3–4 seasons |
For smaller projects aimed mostly at strapping and short conveyor runs, payback often landed in under two seasons. In many cases, the math worked because the gin removed 1–3 manual positions per shift.
Larger integrated systems took more time to pay back. Even so, gin owners said the mix of labor savings and extra bales processed during the fixed harvest window produced more margin than they first expected. Maintenance does add recurring cost, but the main gains still come from lower labor use and fewer bale-handling mistakes.
The next ROI step is moisture control, where automation moves the savings story away from labor and toward energy use and fiber quality.
Case Study Group 2: Moisture Monitoring, Drying Control, and Fiber Preservation
How Moisture Automation Affects Energy Use and Fiber Quality
Moisture automation cuts fuel use and helps protect fiber grade. Dryer systems use roughly one-third of total gin energy, so they’re one of the best places to improve performance with automation. Put simply, moisture control is one of the fastest ways for a gin to see ROI.
Without live moisture data, burner settings often depend on habit or a quick visual check. That usually means dryers run hotter or longer than they need to. And when cotton gets too dry, fiber quality takes a hit. Research found that drying cotton from 6% down to 2.6% moisture increased short fibers under 0.5 inch from 7.8% to 11.2% and reduced yarn strength by about 225 break factor units. About 85% of that drop was tied straight to over-drying. Ginning cotton below 5% moisture has also been shown to cause serious fiber damage.
Modern inline systems use microwave, capacitance, or RF dielectric sensors placed at dryer exits, ducts, and feeder hoppers. Those readings go straight to burner and humidification controls, which helps keep lint in a tight target range - usually 6–7% moisture through ginning and 6.0–7.5% in the finished bale. If the cotton is already dry enough, the system can idle burners on its own.
Bale moisture checks add one more guardrail before shipment. Resistance-type and RF-based bale moisture meters help ginners spot overdry bales below 6% and overly wet bales above 7.5–8% before they leave the gin. That matters because excess bale moisture at 10% has been shown to lower reflectance, increase yellowness, and shift color grade from white to light-spotted after one year in storage. Keeping bales in range helps protect grade and avoid storage losses.
Measured Results: Moisture Consistency, Cost Savings, and Payback
Process control systems with moisture management have delivered energy savings near $1 per bale and about $21 more in per-bale returns from better fiber quality and higher-value sales. In documented cases, IoT-enabled moisture sensor networks cut drying energy by 15–20%.
There’s a lot of room to improve even before automation goes in. Fuel-use efficiency in commercial gin drying systems ranges from 3% to 38%. First-stage systems average about 21%, while second-stage systems average around 9%. That spread tells you something important: many dryers are leaving money on the table.
| Gin Scenario | Moisture Variation Before | After Automation | Drying Fuel Change | Fiber Quality Effect | Payback Estimate |
|---|---|---|---|---|---|
| Process control system with moisture management | Inconsistent; operator-dependent | More consistent throughout the season | About $1/bale energy savings | About $21/bale increase in per-bale returns | 1–3 seasons |
| Humidification added post-ginning | Overdry bales below 6% | Raised toward the target moisture range before baling | Minimal added energy; gas use for humidification can be less than 4% of total heating energy | Improved pressability and fiber/yarn quality | Fast when overdry lint is a recurring problem |
Payback tends to look strong because the gains come from both sides: lower fuel use and better fiber value. A phased rollout often starts with first-stage dryers, then moves into humidification. After that, the next gains usually come from quality protection and less downtime.
Case Study Group 3: Contamination Detection, Process Controls, and Line Stability
Quality Risk and Unplanned Stops Before Automation
After moisture control, contamination detection is one of the fastest ways to protect ROI. It helps stop rejected bales and cuts unplanned line stops. Before automated detection, many gins leaned on operator visual checks and periodic manual inspection. The problem is simple: those checks leave blind spots, and foreign material can slip through.
The cost can get ugly fast. A single 5-gram piece of polypropylene twine in a bale can break into about 10,000 fibers during mill processing, leading to losses of more than $25,000 for apparel and $53,000 for down-proof fabric. Across the U.S. cotton industry, contamination-related losses are estimated at $600 million to $750 million per year.
At the gin level, the hit can be direct. If contamination becomes a repeat issue, average loan value can drop by $0.02 to $0.04 per pound. For a 50,000-bale gin, that adds up to about $400,000 to $800,000 in lost revenue potential over one season, even if only part of the crop takes the hit.
Without sensor-based controls, operators had to retune cleaners by hand as trash loads changed. When trash levels or moisture shifted fast between modules, the line often had to stop so crews could adjust machines or clear blockages. That stop-adjust-restart routine chipped away at output. In practice, it could cut seasonal capacity by 5% to 10%, so a 50,000-bale operation might end up delivering only 45,000 to 47,500 bales.
What the Best Cases Show on Quality and Downtime
The strongest examples show what happens when gins move from manual watching to machine-driven response. Camera-based machine-vision systems now use color cameras, infrared cameras, and deep-learning models at module feeders, feeder aprons, and ducts to spot plastic and other foreign material before it reaches the gin stand.
Systems such as VIPR and the Cotton Gin Stand Machine-Vision Inspection and Removal System combine cameras with pneumatic air knives. These setups can spot plastic in about 25 milliseconds and then eject the contaminant from the cotton stream automatically. That speed matters. By the time a person sees the issue, it may already be too late.
The VIPR system was tested with five types of plastic module wrap. Across three units mounted before the gin stand, it posted a cumulative detection and ejection efficiency of 89.44%. Module feeder inspection systems also add traceability. In one documented 2019 case, a single module feeder processed 41,236 bales and recorded 77 potential contamination incidents, including 18 plastic calls on bales. That made it much easier to trace a contamination event back to a specific module.
PLC controls tie detection directly to action. When cameras flag a problem, the system can divert flow to a bypass chute, pause the bale press, or adjust cleaners up or down automatically. That's a big shift from the old way. Instead of waiting for trouble, stopping the line, and then chasing the issue, the gin responds in real time.
Here’s what that change looks like in day-to-day operating terms:
| Metric | Pre-Automation | Post-Automation | Estimated Financial Effect per Season |
|---|---|---|---|
| Defect bales per 1,000 | 40–60 | 15–25 | Reduction in quality-related discounts worth roughly $80,000–$200,000 for a 40,000–60,000 bale gin |
| Manual interventions per shift | 25–40 | 8–15 | Labor savings equal to 0.5–1 fewer FTE per shift, or $40,000–$80,000 per season |
| Unplanned downtime per 12-hour shift | 1.5–3.0 hours | 0.5–1.5 hours | 5%–15% more throughput; 2,000–5,000 extra bales for a mid-size gin |
| Overall estimated financial effect (quality, labor, and throughput combined) | - | - | $200,000–$600,000 annual net benefit; total investment typically $250,000–$750,000, implying 1–3 season payback |
One medium-size gin makes the payoff easy to see. A site processing about 35,000 bales per season cut annual claim-related losses by about $150,000 after installing broad contamination detection and automated controls. Most of that came from fewer rejected lots and fewer mill complaints.
Case Study Group 4: Data Tracking Software, ROI Comparison, and Investment Priorities
Software Gains in Traceability, Reporting, and Decision-Making
Once the mechanical upgrades are in place, software is what keeps those gains from slipping away. It records bale history, moisture, throughput, and claims in one place. Without solid records, a gin has no clear way to see if a moisture system is drifting, which shift is slowing output, or which producer’s modules are driving the most rejects.
Modern gin management software pulls bale serialization, producer and load tracking, moisture records, and production timing into a single workflow. Each bale receives a Permanent Bale Identification (PBI) number tied to the producer, field, load, net weight, moisture reading, and gin date/time. So when a quality dispute shows up, managers can pull the full history fast instead of digging through handwritten logs.
That time savings adds up. One digital inventory system reduced manual data entry by 3–4 hours per day, which saved about $40,000 per year.
Live bale counts, producer totals, and throughput rates also give supervisors a direct view of line performance while the season is still moving. During harvest, that matters. A live dashboard lets a manager spot a slowdown and deal with it on the same shift, not three days later when the damage is already done.
RFID-based module tracking is spreading too. It allows field registration of modules and automatic data transfer from the field to the gin system, without extra tagging or paint marking.
Digital records also make routine admin work less painful. They simplify:
- origin verification
- classing reconciliation
- sustainability reporting
- audit responses
Which Automation Tools Pay Back Fastest
This is where software starts to look less like an add-on and more like the control layer for labor, moisture, and quality gains. Across these case studies, the pattern is pretty clear: the fastest payback usually comes from fixing the most obvious bottleneck first.
In many cases, software pays back sooner because it costs less upfront and starts cutting manual reconciliation work right away.
| Automation Category | Problem It Solves | Main Savings Source | Best-Fit Gin Profile | Typical Payback Profile |
|---|---|---|---|---|
| Automated bale handling | Manual handling bottlenecks and labor pressure | Labor reduction | High-volume gins with large end-of-line crews | Best when manual handling is a clear bottleneck |
| Moisture monitoring & drying control | Energy waste and fiber grade loss | Fuel savings + grade protection | Mid-to-large gins with variable moisture loads | Best when paired with bale-level moisture logs |
| Contamination detection & process controls | Quality-related stops and rejected bales | Quality discounts avoided + uptime | Gins with recurring contamination complaints | Best when quality stops are frequent and costly |
| Data tracking & gin management software | Manual entry errors and poor visibility | Labor savings + faster decisions | Gins of all sizes with weak recordkeeping | Often the fastest to deploy; can pay back in 1–3 seasons when it replaces manual entry and reconciliation work |
A $120,000 moisture control system that returns $45,000–$60,000 per season through fuel savings and grade protection reaches payback in 2–3 seasons. But there’s a catch: those gains are much easier to prove when bale-level moisture records and production logs are already in place.
That’s the part people sometimes miss. Software doesn’t only report the result after the fact. It helps protect the ROI of the mechanical systems already installed.
Conclusion: Key Takeaways for Gin Owners and Investors
The main point is simple: the best investment is the one that removes the most expensive day-to-day friction.
Automation pays back fastest when it fixes a measured bottleneck, not a guessed one. Larger gins can spread fixed software and control costs across more bales. Smaller gins usually get faster wins from lower-cost software and one focused upgrade rather than a full rebuild.
A good starting point is to look at the numbers that hurt the most each day:
- labor hours
- downtime
- moisture variance
- reporting time
That’s usually where the next dollar should go.
FAQs
Which automation upgrade should a gin start with first?
Start with a baseline audit of bottlenecks in your operation. Then focus on upgrades that can deliver fast, measurable gains in throughput or cut strain on labor.
A simple phased plan looks like this:
- Year 1: Begin with hydraulic upgrades such as smart-flow pumps. These can increase processing speed by about 20% for around $30,000.
- Year 2: Add robotics for cleaning.
- Year 3: Bring in AI-driven IoT integration.
Do a cost-benefit analysis before making any move.
How does gin size affect automation payback?
Gin size has a big impact on automation payback.
Larger gins can spread fixed costs across more bales. That often leads to a faster ROI because they move more cotton through the system and can save more on labor and energy.
Smaller gins usually face a higher upfront cost compared with their output. Even so, payback can still come fast when automation fixes a clear bottleneck, like labor-heavy jobs or moisture-control problems.
What data should I track before investing in automation?
Before you put money into automation, start with a baseline audit. In plain English, that means measuring how your operation performs right now so you have something solid to compare against later.
Track throughput across 100 bales, along with HVI rejects, non-lint percentages above 2.5%, bales per hour, kWh per bale, and total labor costs.
It also helps to watch the business side of the line, not just the production side. Look at gross profit per bale, operating margins, lint turnout percentage, maintenance needs, and any bottlenecks that cause downtime.
Those numbers give you a dependable cost-benefit baseline. Without them, it’s tough to tell whether automation is cutting costs, easing slowdowns, or just shifting problems from one part of the plant to another.