In cotton spinning mills, productivity is everything - especially since ring spinning accounts for about 70% of total costs. Tracking the right metrics can help reduce inefficiencies, lower costs, and boost profits. Here’s what you need to focus on:
- Machine Efficiency: Measure Ounces per Spindle Shift (OPS). High-performing mills achieve speeds of 20,000–25,000 rpm with minimal breakage rates (2–3 breaks per 100 spindle hours). Regular maintenance, climate control, and consistent fiber mixes are key to improving OPS.
- Labor Productivity: Track Workers per 1,000 Spindles (OHS). Efficient mills maintain low OHS by optimizing labor allocation and investing in automation like auto-doffers and high-speed combers. Training workers and monitoring idle spindles can further improve performance.
- Energy Management: Measure energy consumption per kilogram of yarn. Modern machinery and digital tools like ERP systems help cut energy use. For example, newer carding machines consume 50% less energy than older models.
- Material Yield & Waste: Calculate Yarn Realization (YR) to track how much cotton turns into yarn. Efficient mills achieve 85%–90% YR for carded yarns. Reduce waste by maintaining proper humidity, recycling soft waste, and managing fiber blends carefully.
- Composite Productivity Index (CPI): Combine all metrics into one score to assess overall performance. Tools like the COTTON USA Mill Performance Index® benchmark global standards and help identify areas for improvement.
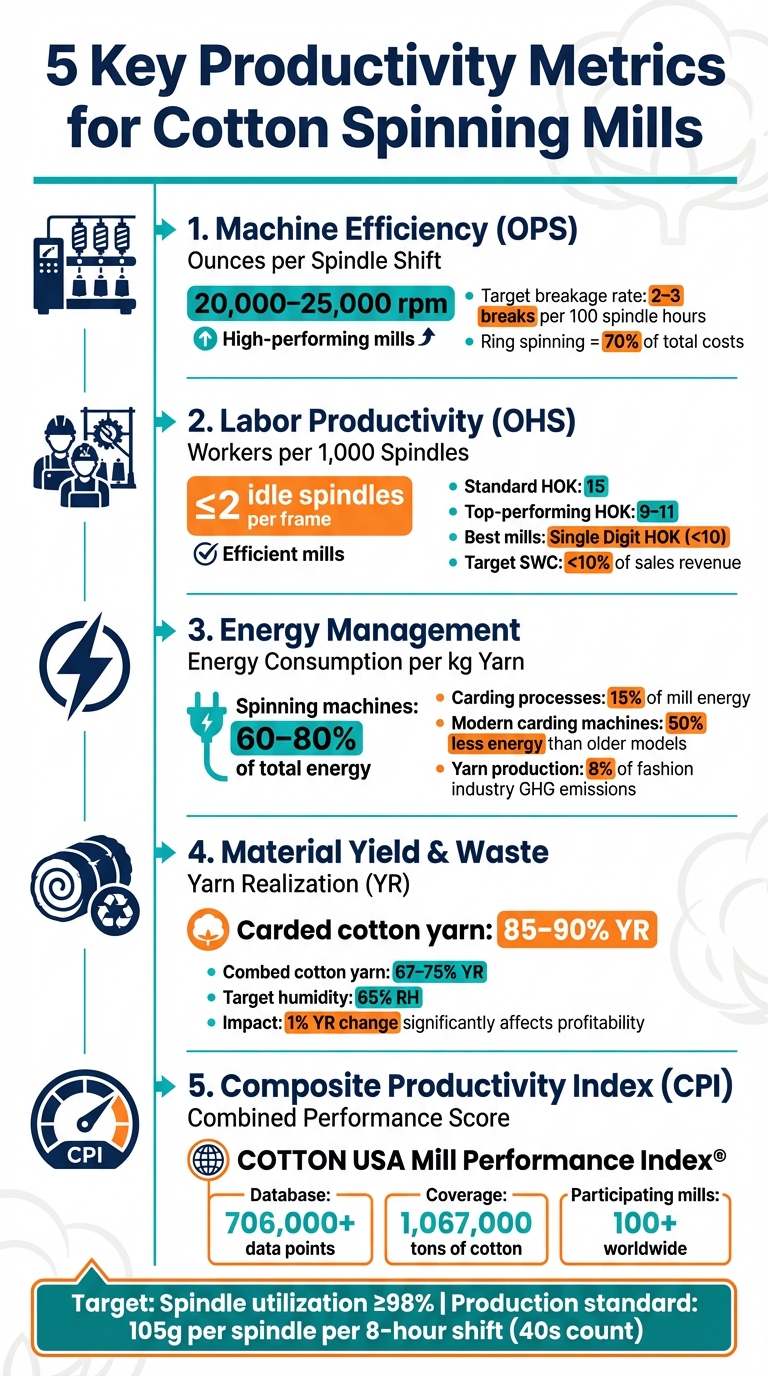
5 Key Productivity Metrics for Cotton Spinning Mills
Machine Efficiency and Ounces per Spindle Shift (OPS)
How to Calculate OPS for Performance Tracking
Ounces per Spindle Shift (OPS) - or sometimes measured in grams - serves as a key metric for assessing ring frame productivity. It measures the weight of yarn produced by a single spindle during a standard shift. Calculating OPS is straightforward: divide the total weight of yarn produced in a shift by the number of active spindles. For instance, if a ring frame with 400 spindles produces 8,800 ounces of yarn in an 8-hour shift, the OPS equals 22 ounces per spindle.
This calculation offers a clear view of machine performance and its connection to cost savings. Since ring spinning contributes to about 70% of conversion costs, even small increases in OPS can significantly reduce production expenses. High OPS levels depend on balancing faster mechanical speeds with minimal breakage rates. Top-performing mills report 2–3 breaks per 100 spindle hours while running speeds of 20,000–22,000 rpm for medium counts (30s–40s) and up to 24,500 rpm for finer counts (60s–76s). However, OPS outcomes are also shaped by factors like ring diameter, spindle drive type, machine age, lift capacity, and the overall mechanical state of the ring frames.
Ways to Improve OPS
Once you’ve calculated OPS, the next step is to focus on strategies to enhance it. A good starting point is conducting snap rounds - quick checks during shifts to tally idle spindles and identify issues like spindle breaks, lapping, roving exhaustion, or mechanical failures. According to Shri Gaurav Doshi, mills with 2 or fewer idle spindles per frame are considered efficient. Some mills, particularly in Indonesia, have pushed this benchmark even further, achieving fewer than one idle spindle per frame.
Routine maintenance is another crucial factor. Inspect cots and aprons daily or every 2–3 days to prevent quality degradation, especially when operating at higher speeds. Standardizing mechanical settings - like total drafts, roller configurations, and twist multipliers - across machines using the same fiber mix also helps reduce variability and maintain consistent performance.
Climate control plays a significant role in reducing breakage rates. Use digital meters to monitor and maintain ideal humidity and temperature levels. Finally, arranging fiber bales in serial order ensures consistent fiber properties, allowing for smoother high-speed operation without compromising yarn quality. By improving OPS, mills not only enhance the output of individual machines but also elevate their overall productivity levels.
sbb-itb-0e617ca
Labor Productivity: Workers per 1000 Spindles (OHS)
What OHS Means and Why It Matters
Workers per 1000 Spindles (OHS) is a key metric for understanding labor productivity in textile mills. It measures the number of workers needed to operate 1,000 spindles, giving insight into how effectively the workforce is being utilized. Unlike machine-focused metrics like OPS (Ounces per Spindle Shift), OHS zeroes in on the human element, assessing how well labor is allocated relative to machine capacity. This metric pairs closely with HOK (Operative Hours per 100 kg of yarn), which tracks the total labor time spent to produce a specific output, providing a more complete picture of efficiency.
Higher OHS values can point to overstaffing or inefficiencies caused by technical issues. For example, high-performing mills in India and Indonesia manage to keep breakage rates low - about 2–3 breaks per 100 spindle hours - even while running machines at speeds of 20,000–25,000 rpm. Keeping labor costs in check is another priority. Many mills aim to keep salaries and wages (SWC) under 10% of sales revenue. High-tech mills and Export Oriented Units often achieve even lower SWC levels, ranging between 1.5% and 3% of sales turnover. According to benchmarking data from the South India Textile Research Association (SITRA), standard mills aim for an HOK of around 15, while top-performing mills achieve an HOK as low as 9–11. The best mills manage to hit "Single Digit HOK", meaning fewer than 10 operative hours are required to produce 100 kg of yarn. Understanding OHS is a critical step in fine-tuning labor strategies and improving overall efficiency.
Methods to Improve Labor Productivity
Improving labor productivity isn’t just about machines - it’s also about smarter workforce management. Start by conducting quick snap rounds to identify idle spindles and document the reasons behind them. If more than 2 spindles per frame are idle, it’s often a sign of either poor labor allocation or maintenance issues. Efficient mills aim to keep idle spindle counts much lower, ensuring smoother operations.
Another effective approach is reassessing work assignments. For instance, a mill with 20,000 spindles collaborated with SITRA to optimize labor distribution. By reallocating tasks, the mill reduced its workforce by 69 operatives per day and lowered its HOK from 14.5 to 13. The goal is to strike a balance - workers shouldn’t be overloaded or underutilized.
Automation also plays a big role in cutting labor needs. One SITRA member mill achieved an impressive 8.8 HOK by implementing advanced machinery like long-length ring frames with auto-doffers, chute feed blow rooms, and high-speed combers. Additional technologies, such as bale pluckers and auto-leveller draw frames, can further reduce manual labor requirements.
Investing in worker training is another game-changer. Training programs help employees improve their technical skills and complete tasks faster, enabling them to handle high-speed operations without increasing headcount. Pair this with proper environmental controls - like using digital meters to maintain optimal humidity levels - and you can prevent issues like fiber lapping and excessive breakages, which often lead to higher labor demands.
Finally, track Overall Labor Effectiveness (OLE) to measure progress. OLE is calculated as (Standard Hours / Total Productive Hours) × Productivity %. This metric ensures that any reductions in labor hours or increases in production are accompanied by real efficiency gains.
Energy Efficiency: Energy Consumption per kg Yarn
How to Measure Energy Consumption per kg Yarn
Tracking energy consumption per kilogram of yarn is a key step toward improving both operational costs and environmental impact. To calculate this, measure the total energy usage - combining electricity and natural gas - and divide it by the yarn output during a specific timeframe. Tools like the ENERGY STAR Portfolio Manager can help monitor and analyze your energy use in relation to production.
This metric highlights the dual advantage of cost reductions and environmental responsibility. For instance, spinning machines account for 60% to 80% of the total energy used in yarn manufacturing, while carding processes can consume up to 15% of a mill's energy. Additionally, yarn production contributes to roughly 8% of the fashion industry's greenhouse gas emissions, making energy efficiency essential for both economic and ecological reasons.
The COTTON USA Mill Performance Index® offers a robust benchmarking system, leveraging over 706,000 data points to track energy management across five major cost drivers. As the creators explain:
"The COTTON USA Mill Performance Index® shows how your mill compares to your competition all over the world and gives you a road map to improving your productivity and yields".
This level of insight not only shows how your mill stacks up globally but also helps identify realistic areas for improvement. These measurements are the foundation for achieving meaningful energy savings.
Ways to Reduce Energy Costs and Improve Efficiency
Optimizing energy use is crucial for improving mill performance. Choosing the right spinning technology can make a significant difference. For example, rotor spinning is the most energy-efficient method compared to ring, compact, and air-jet spinning. If switching technologies isn't feasible, upgrading to modern machinery can yield substantial savings. Take the Rieter C 81 card, which consumes 50% less energy while delivering 40% more fiber sliver compared to older models from 2000. Similarly, the Rieter J 70 air-jet spinning machine has reduced electricity use by 3% and compressed air consumption by 5% compared to its predecessor.
Digital tools also play a pivotal role in improving efficiency. For instance, Super Sales India Limited (SSIL) adopted a textile ERP system in May 2024 that integrated production planning, inventory management, and quality control. The system, equipped with IoT and real-time monitoring, identified inefficiencies across operations. Cloud-based ERP systems with IoT integration can cut cycle times by as much as 90%, enabling mills to address energy inefficiencies in real time.
Predictive maintenance is another effective strategy. By using Enterprise Asset Management (EAM) software, mills can transition from reactive repairs to data-driven preventive maintenance. This ensures machines operate at peak efficiency while minimizing unexpected downtime. Incorporating quality monitoring tools like USTER, HVI, and CASCADE within your ERP system can further pinpoint energy waste caused by poor quality or machine inefficiencies. As Rieter emphasizes:
"In times of rising energy costs, energy efficiency also enhances the competitiveness of spinning mills".
Some manufacturers are already setting ambitious goals, aiming to reduce energy consumption by 15-16% by 2025 and up to 22% by 2030 compared to 2021 levels.
Material Yield and Waste Reduction
How to Calculate Yield and Waste Metrics
Improving yield and cutting down on waste are essential for boosting mill efficiency. A critical metric in this process is Yarn Realisation (YR), which measures how much raw cotton is turned into finished yarn. To calculate YR, simply divide the weight of yarn produced by the weight of cotton consumed, then multiply by 100. For instance, if your mill processes 1,000 lbs of cotton and produces 870 lbs of yarn, the yarn realisation is 87%. Typical YR values range between 85% and 90% for carded cotton yarns and 67% to 75% for combed cotton yarns. Even a modest 1% change in YR can have a big impact on profitability.
Waste in spinning mills generally falls into three categories:
- Soft waste: Includes sliver bits, lap bits, roving ends, and roller waste. This type of waste can often be reused in production.
- Hard waste: Material that cannot be recycled back into the spinning process.
- Invisible loss: Occurs when cotton loses moisture weight during storage due to its hygroscopic nature.
Tracking weight losses during key stages - such as the blow-room, carding, and combing - can help identify areas for improvement.
Waste Reduction Techniques
Once yield losses are measured, the next step is implementing strategies to reduce waste. Maintaining a relative humidity of 65% during mixing, winding, and packing can help minimize moisture loss and reduce fluff generation. Proper bale management, including testing and sorting fibers from different bales, enables mills to blend materials strategically, balancing yarn quality and cost.
Monitoring trash content is also critical. Contaminants like leaf fragments, bark, dust, and sand can lower YR. Additionally, cotton lint with more than 25% short fibers can hurt both productivity and quality. Recycling soft waste by blending reusable fibers into coarser yarn counts or producing recycled yarn can improve profitability. For combed yarns, controlling noil extraction is essential; while removing more short fibers improves yarn quality for finer counts, it reduces overall yield.
| Yarn Type | Typical Yarn Realisation (%) |
|---|---|
| Carded Cotton Yarn | 85% – 90% |
| Combed Cotton Yarn | 67% – 75% |
Composite Productivity Index (CPI): Combining Key Metrics
What the Composite Productivity Index Measures
The Composite Productivity Index (CPI) brings together multiple performance metrics into a single, unified score. Instead of analyzing machine productivity, labor productivity, material yield, efficiency management, and energy management separately, the CPI consolidates these five key cost drivers. This combined approach provides a clearer picture of how different aspects of operations influence each other, making it easier to identify trends and interdependencies.
A noteworthy example of this is the COTTON USA Mill Performance Index®. This benchmarking tool is built on an extensive database containing over 706,000 data points and 1,067,000 tons of cotton. It offers anonymous and reliable global performance comparisons, supported by patented technology that ensures all mill-specific data remains completely confidential.
Using CPI to Evaluate Overall Performance
The CPI is designed to offer a comprehensive performance review by integrating individual metrics into a single score. It helps pinpoint areas that need improvement, whether it’s machine productivity, labor efficiency, material yield, or energy usage. For instance, if material yield and machine productivity are performing well but energy management is underperforming, the CPI highlights where to direct resources and make operational changes.
In June 2023, Cotton Council International (CCI) introduced the COTTON USA Mill Performance Index™ at the ITMA exhibition in Milan. This launch followed a pilot program that included 47 mills across 13 countries. Data from the pilot demonstrated how combining these metrics allowed mills to identify how specific fiber choices improved spindle speeds, reduced "ends down", and increased yields for both combed and carded yarns. Bruce Atherley, Executive Director of CCI, emphasized the tool's impact:
"The benchmarking capability of this tool... has the potential to transform a mill's performance. The COTTON USA Mill Performance Index™ shows how mills compare to their direct competition and how sourcing U.S. cotton ultimately increases productivity and provides higher yields".
Participation in this index requires mills to consume at least 10,000 bales of U.S. Upland and Supima cotton and be members of the U.S. Cotton Trust Protocol®. To date, over 100 mills worldwide have adopted this tool to monitor and improve their competitive positioning.
Conclusion: Improving Productivity for Long-Term Growth
Key Takeaways for Mill Operators
Sustained profitability in the spinning industry depends on cutting production costs while maximizing both machine and labor efficiency. To achieve this, keep a close eye on five critical cost drivers: material yield, machine productivity, labor productivity, efficiency management, and energy management. Regular benchmarking against global competitors is vital to staying ahead.
One key metric to monitor is your Salaries and Wages Cost (SWC). For profitability, this figure should stay below 10% of sales revenue. Leading mills manage to keep it between 3% and 5%. A study of 183 spinning mills revealed an average SWC of 8.1%, with a wide range from 1.5% to over 20%. This variability highlights how much productivity improvements can influence financial outcomes.
Here are three immediate actions to focus on:
- Maintain spindle utilization at 98% or higher to minimize unnecessary downtime.
- Evaluate labor distribution carefully. Two-thirds of labor productivity gaps stem from overstaffing, while one-third result from lower production per spindle.
- Aim for a production standard of 105g per spindle per 8-hour shift (40s count), well above the industry average of 92g.
By consistently monitoring these metrics, mills can not only address current challenges but also position themselves to embrace technological advancements.
Future Trends in Productivity
Beyond these immediate steps, mills must prepare for the future. Automation and data-driven strategies are revolutionizing the industry. Advanced machinery, such as bale pluckers, chute feed blow rooms, auto-leveller draw frames, and long-length ring frames with auto-doffers, is helping mills achieve labor productivity levels below 10 HOK (Hours per 1000 Spindles). Additionally, Automatic Waste Evacuation Systems (AWES) in blow rooms, cards, and combers are becoming essential for improving efficiency.
The shift toward centralized, automated control systems will further separate high-performing mills from those struggling to compete. To stay ahead, mills should focus on modernizing equipment, updating workforce training, and continuously benchmarking their performance. These steps will not only sustain productivity but also enable mills to adapt to changing market demands and technological advancements.
Maximizing Quality, Productivity, Efficiency & Profits of Textile Mills
FAQs
What’s the fastest way to spot why spindles are idle?
To figure out why spindles are sitting idle, start by looking at spindle stoppages. Common culprits include power outages, mechanical breakdowns, or material shortages. These issues can significantly impact how efficiently your spindles are being used. Keeping a close eye on these factors allows you to tackle problems quickly, boosting productivity in the process.
How do I set realistic OPS and OHS targets for my yarn counts?
To establish achievable targets for OPS (operatives per 1,000 spindles) and OHS (operative hours per 100 kg of yarn), start by reviewing your current productivity metrics. Compare these figures against industry benchmarks, such as the SITRA standards, to gain a clear understanding of where you stand.
Key factors to evaluate include:
- Operator skill levels: Assess the expertise and training of your workforce.
- Machine efficiency: Determine how well your equipment is performing.
- Operational hours: Analyze how time is being utilized during production.
Set goals that challenge your team but remain within reach. Track your progress consistently, and be ready to make adjustments based on actual performance. This approach will help drive steady improvements in productivity over time.
Which upgrade cuts energy per lb of yarn the most?
Replacing rotor spinning machines with alternatives such as ring spinning or air-jet spinning can drastically cut energy use per pound of yarn. These technologies offer energy savings of 37% and 69%, respectively, making them strong choices for boosting energy efficiency in cotton spinning mills.