If I had to boil this down to one point, it’s this: cotton profit usually comes down to five numbers - profit per acre, lint yield, gin turnout, water-use efficiency, and input ROI. When I track those by field, I can see where money is made, where it leaks out, and which costs are worth keeping.
Here’s the short version:
- Start with field profit, not farm averages. A field can look fine on average and still lose money in weak zones.
- Use breakeven numbers early. In one cited example, a 400 lb/ac dryland budget showed a variable-cost breakeven near $0.54/lb and a total-cost breakeven near $0.80/lb.
- Map yield by zone. A 25% yield drop can push breakeven from about $0.57/lb to $0.80/lb.
- Watch irrigation timing, not just total water. Research cited here found that skipping early vegetative irrigation cut water use by about 30% while yield fell only 6%.
- Measure water in lint, not inches alone. I want to know how many lb/ac-inch each pass is buying.
- Bring gin data into the same field record. Turnout, micronaire, strength, and length all affect the final check.
- Track ROI by input type. Seed, fertility, chemicals, pest control, and pumping costs should each earn their keep.
- Update the same dashboard at planting, midseason, and harvest. That keeps costs, yield, and risk in one place.
A few numbers in the article stand out. 86% of U.S. cotton growers already use autosteer/GPS systems, which means a lot of farms already have part of the data trail in place. University of Georgia trials from 2013–2017 also showed sensor-based irrigation scheduling beat fixed-calendar scheduling for yield and profit.
| What to track | Why I track it | What it helps me decide |
|---|---|---|
| Profit per acre | Shows if a field paid after costs | Lease, crop mix, keep or cut inputs |
| Cost per lint pound | Sets my price floor | Marketing and breakeven planning |
| Yield by zone | Finds weak and strong spots | Variable-rate or zone-based input plans |
| Water-use efficiency | Tests if irrigation paid | Timing and number of passes |
| Gin turnout + quality | Explains revenue gaps | Variety picks and field ranking |
| Input ROI | Shows payback on each dollar spent | Fertility, pest, and chemical choices |
Bottom line: I don’t need more spreadsheets. I need clean field IDs, cost records, yield maps, irrigation logs, weather data, and gin reports tied together so each field can be judged on dollars, not guesses.
Build a Profit Baseline Using Field-Level Metrics and Maps
Calculate Per-Acre Profit, Cost Per Lint Pound, and Gross Revenue
With the core metrics set, the next move is to build a field-level baseline. Start with a simple question: what did each field earn after all costs were paid?
Gross revenue is the value of lint plus cottonseed before expenses. Net return per acre equals total revenue minus total costs. Cost per lint pound equals total costs divided by lint yield. If you use only variable costs, you get the variable-cost breakeven.
District budgets are a starting point, not the final word. Adjust them for your irrigation system, labor, and local gin rates. Using the 400 lb/acre District 2 dryland budget, the variable-cost breakeven is $0.54/lb and the total-cost breakeven is $0.80/lb. If the expected price lands between those two numbers, the field covers variable costs but not fixed costs. That matters when you're making lease and land calls.
Include cottonseed revenue in every baseline. It can help offset fertilizer inflation.
Use Yield Maps to Find High-Return and Low-Return Zones
A farm-wide average can smooth over big differences inside a single field. That's where yield monitor data helps. When you clean it up and map it by field, you can see where the money is made and where it slips away.
Overlay yield maps with soil and irrigation layers to spot high- and low-return zones. This turns harvest data into decisions you can act on.
A zone that keeps producing good returns with average inputs may deserve more investment. A zone that struggles even after full inputs may need less input spending or a different plan. In some dryland cases, a 25% drop in expected yield can push the variable-cost breakeven price from $0.57/lb to $0.80/lb. That's a big jump. It shows why yield-sensitive zones should be mapped and watched closely for risk management.
Once those zones are clear, you can start matching inputs to the parts of the field that pay you back.
Table: Key Cotton Profit Metrics and How to Use Them
Use these metrics to compare fields before changing inputs or marketing decisions.
| Metric | Required Data | Update Frequency | Management Decision Supported |
|---|---|---|---|
| Per-Acre Profit | Lint + seed revenue minus all costs | Post-harvest / annual | Farm viability; lease renewals |
| Cost per Lint Pound | Total costs ÷ lint yield | Pre-planting / seasonal | Breakeven price floor; marketing strategy |
| Return Over Variable Costs | Revenue minus direct input costs | Seasonal | Plant vs. fallow; short-term production calls |
| Lint Yield (lb/ac) | Harvest weights; gin reports | Per field / per load | Field comparisons; zone analysis |
| Gin Turnout (%) | Lint weight ÷ total harvested weight | Per module / per load | Variety selection; harvest efficiency |
| Input ROI | Yield increase × lint price ÷ input cost | Per application | Fertilizer and chemical rate changes |
| Yield Sensitivity | Historical yield maps; 25% reduction scenarios | Annual | Risk management; stress-prone zone identification |
sbb-itb-0e617ca
Crop Yield Estimation - Cotton Stand Counting
Use Yield, Irrigation, and Weather Data to Cut Input Waste
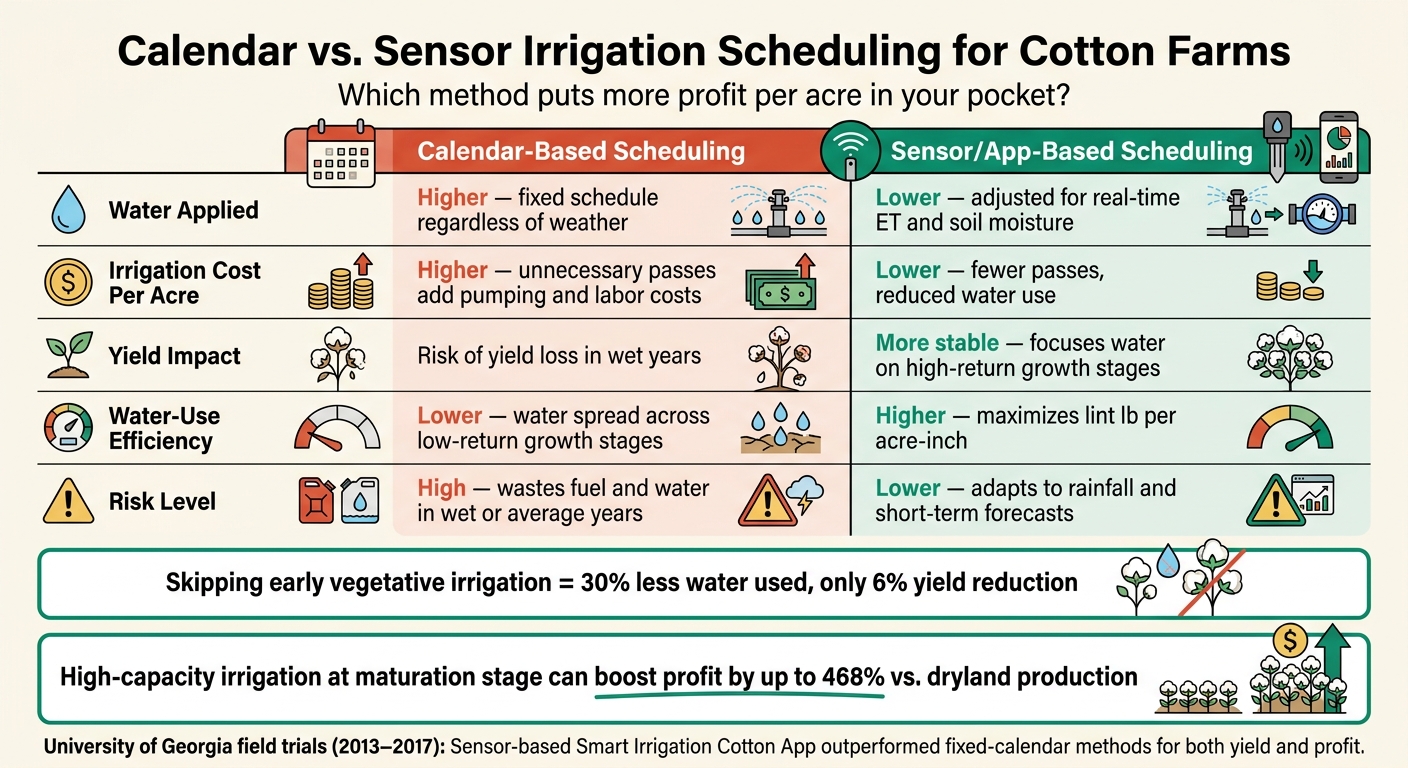
Calendar vs. Sensor Irrigation Scheduling for Cotton: Key Differences & Profit Impact
Turn Soil Moisture and Rainfall Data Into Better Irrigation Timing
With your profit baseline in place, irrigation is often one of the fastest ways to cut waste. Not every pass pays for itself. The key is knowing when water will do the most good, and that starts with where the crop sits in the season.
Cotton’s water sensitivity changes as the crop moves through the year. Using Growing Degree Days (GDD, base 60°F), you can split the season into early vegetative, reproductive, and maturation stages. At Texas A&M AgriLife’s Halfway, TX, research found that skipping irrigation during the early vegetative stage saved about 30% water, while yield fell by only 6% compared with medium-capacity irrigation. That’s a pretty clear signal: keep more of your pumping budget for the maturation stage, where the payoff from water is strongest and per-acre profit moves the most.
A simple setup can help a lot here. Place soil moisture sensors about 15 inches deep to monitor the active root zone. Then pair those readings with short-term weather forecasts so you don’t irrigate right before a rain. Start irrigation when ETa drops to 50%–60% of ETc or when WSI reaches 0.4–0.5. And if rainfall meets or exceeds ET0, skip that pass.
Measure Water-Use Efficiency in Profit, Not Just Inches
Once your timing is dialed in, the next step is checking whether each acre-inch is earning its keep. Don’t just track inches applied. Track lint pounds per acre-inch.
The math is simple: divide lint yield by total acre-inches applied, then weigh the cost of one more irrigation pass against the lint value that pass might add. That gives you a much clearer picture of whether more water is helping - or just adding cost.
Extra pumping is more expensive now because of fuel, labor, and water costs. So if a late pass is only likely to add a small amount of lint, it may not pencil out. On the other hand, high-capacity irrigation of about 0.25 inches per day during the maturation stage can boost profit by as much as 468% compared with dryland production. Timing is the whole ballgame.
Table: Calendar vs. Sensor Irrigation Scheduling
The gap gets easier to see when you line up fixed-calendar irrigation against sensor-based scheduling.
| Feature | Calendar-Based (Checkbook) | Sensor/App-Based Scheduling |
|---|---|---|
| Water Applied | Higher; fixed despite weather | Lower; adjusted for real-time ET and soil moisture |
| Irrigation Cost/Acre | Higher; unnecessary passes add pumping and labor costs | Lower; reduced water use and fewer unnecessary passes |
| Yield Impact | Risk of yield loss in wet years | More stable; focuses water on high-return growth stages |
| Water-Use Efficiency | Lower; water spread across low-return growth stages | Higher; maximizes lint lb per acre-inch |
| Risk | High; wastes fuel and water in wet or average years | Lower; adapts to rainfall and short-term forecasts |
Across five years of University of Georgia field trials from 2013–2017, the Smart Irrigation Cotton App posted the best overall results for yield and profit, showing that sensor-informed scheduling can beat fixed-calendar methods.
Add Gin Turnout, Fiber Quality, and Input ROI to Your Analysis
Once you’ve got water timing dialed in, the next step is simple: figure out how much of that crop value still exists after the gin. Yield matters, of course. But gin turnout and fiber quality play a big part in how much of that yield turns into money. Net profit comes down to three things: lint revenue, cottonseed revenue, and variable costs.
Use Gin Turnout and Quality Reports to Explain Revenue Differences
Gin reports help explain why two fields that looked almost the same at harvest can end up with different returns. Gin turnout is a critical factor in determining how much lint you get from harvested seed cotton, and changes in turnout can lead to different revenue per acre even when fields look similar at harvest. Fiber quality metrics - staple length, strength, micronaire, and trash content - can also add premiums or discounts to the base lint price.
That’s the part many growers feel in the check but don’t always trace back right away. Two fields can post similar seed-cotton yields and still bring in different revenue per acre once the gin report lands.
Total revenue per acre should combine lint revenue and cottonseed revenue. Profit analysis should also separate returns over variable costs from returns over total costs. Why does that matter? Because a field that covers variable costs is still helping pay fixed costs, even if it doesn’t cover the whole bill.
Track Input ROI by Variety, Fertility Program, and Pest Strategy
Judge input ROI with itemized budgets, not memory or farm averages. Build field budgets from your own records and compare scenarios by variety, fertility, and pest control. With input costs climbing, return above variable costs is the clearest test of whether an input paid its way.
Look at fields or varieties side by side using yield, turnout, quality, and net return. Use the same field IDs across yield maps, gin reports, and cost records so every comparison pulls from the same set of data. Then feed those comparisons into your dashboard so each field can be followed through the season.
Table: Compare Fields or Varieties by Yield, Turnout, Quality, and Profit
| Metric | Data Source | Why It Matters |
|---|---|---|
| Lint Yield (lb/ac) | Harvest weights; gin reports | Main revenue driver; starting point for all comparisons |
| Gin Turnout (%) | Gin report per module or load | Explains lint recovery differences between fields or varieties |
| Fiber Quality Adjustments | HVI data: Micronaire, strength, length | Adds to or cuts the base lint price; affects net revenue |
| Cottonseed Revenue ($/ac) | Gin settlement; cottonseed price | Helps offset variable costs; must be included in total revenue |
| Total Variable Cost ($/ac) | Itemized field budget | Sets the breakeven floor; basis for return over variable costs |
| Net Return per Acre | Revenue minus total costs | Final measure of field or variety performance |
| Input ROI | Yield and quality gain ÷ input cost | Shows which variety, fertility, or pest program paid its way |
Build a Season-Long Management System Around Your Data
Set Up a Simple Dashboard for Budgets, Field Results, and Year-Over-Year Trends
Once your field data starts to explain performance, bring those same numbers into one season-long dashboard. The goal is simple: see what each field is earning, what it is costing, and whether it can cover variable costs while still helping pay fixed costs.
A practical dashboard tracks revenue per acre, variable cost per acre, breakeven price, and returns over variable costs by field. Update it at planting, midseason, and harvest. It should also include year-over-year trends for yield, turnout, and net return by field or variety. The University of Arkansas National Cotton Profit & Loss Calculator can help with itemized budgets, and the Farm Enterprise Budget Tool tab lets you adjust expense assumptions for your own operation.
Breakeven price is the main in-season risk metric. When fuel and fertilizer costs climb, breakeven can move up fast.
| Dashboard Metric | When to Update | Why It Matters |
|---|---|---|
| Revenue per Acre | Post-harvest | Confirms actual lint and cottonseed income by field |
| Variable Cost per Acre | Monthly during the season | Catches cost overruns before they compound |
| Breakeven Price ($/lb) | At planting and whenever input costs change | Tracks financial risk as prices move |
| Return Over Variable Costs | Key milestones during the season | Shows whether the crop is covering production expenses |
| Return Over Total Costs | Post-harvest | Final field-level comparison |
Use cottongins.org to Support Gin Coordination and Data Collection
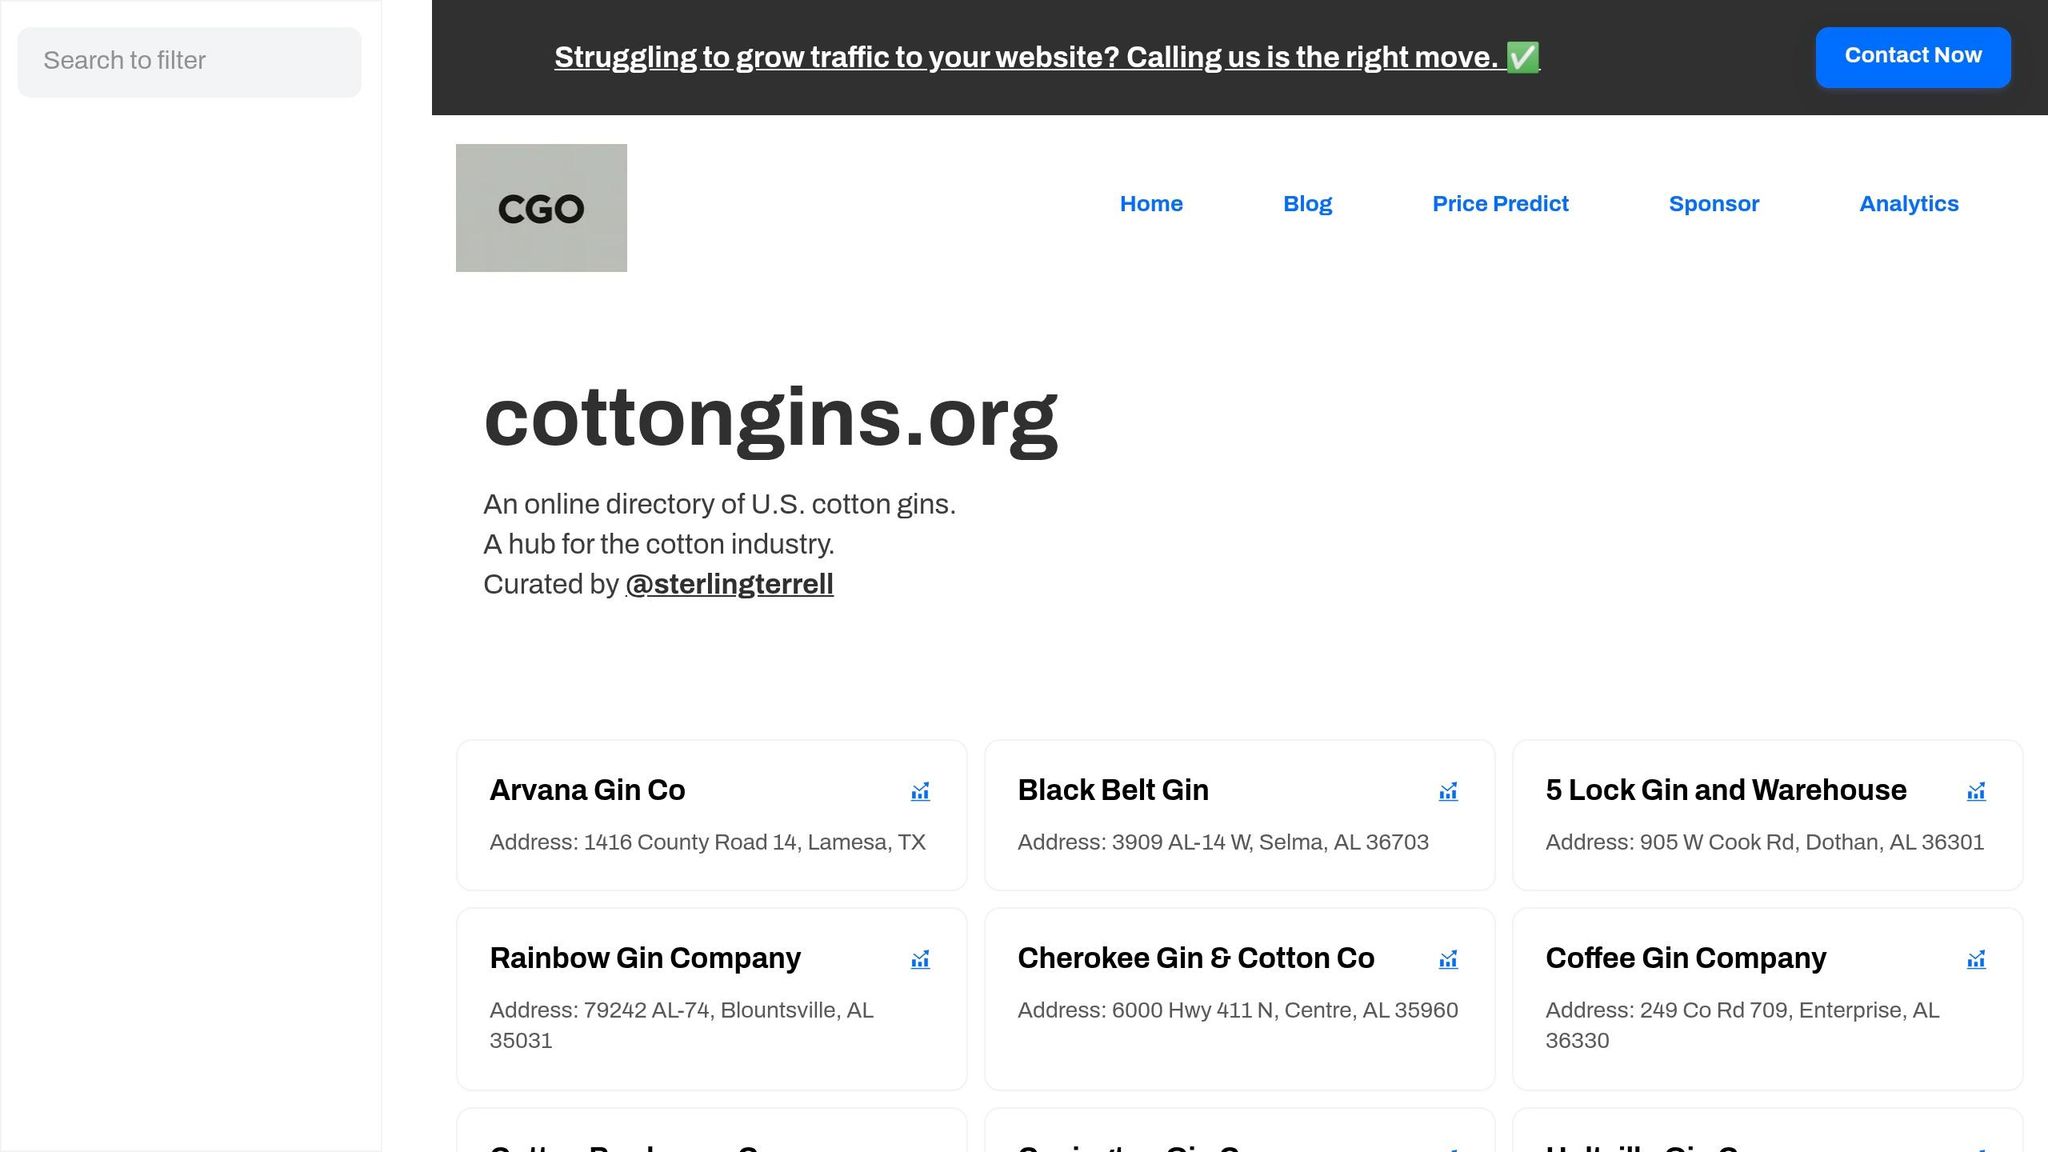
After harvest, match each gin ticket back to the field that produced it. cottongins.org is a directory of U.S. cotton gins that helps producers find gin facilities and coordinate with service partners. It also helps connect turnout and quality records to the right field, so gin turnout (GTO), micronaire, strength, and length data can flow into your field records and dashboard comparisons for field-level profit analysis.
Conclusion: The Metrics That Most Often Improve Cotton Profitability
The growers who improve margins year over year tend to track the same field-level numbers: returns over variable costs, breakeven price, gin turnout, fiber quality, and input ROI. And they do it with real cost records, not rough guesses.
Pull gin turnout and fiber quality reports into the same field IDs used from planting through ginning so each update stays tied together. A spreadsheet and clean field records are enough. The part that makes the difference is updating them at planting, midseason, and harvest, then comparing fields year over year. That is what turns data into decisions.
FAQs
What data should I track first?
Start with the data that helps you spot and cut your biggest costs. A good first step is yield maps from harvester-mounted monitors. They show which parts of a field produce well and which parts fall behind.
Then pair that data with soil sampling for nitrate, ammonium, and organic matter. When you compare yield data with your input records, you can build profit maps that show where you’re making money and where you’re losing it.
How do I calculate cotton breakeven by field?
Calculate breakeven by field by finding the price or yield needed for revenue to match production costs.
Breakeven price = total cost / expected yield.
Breakeven yield = total cost / expected price.
Use variable costs only for short-term operating decisions. Use total costs when you want to judge long-term profit.
For harvest decisions, focus on variable costs tied to bringing the crop in, such as:
- Ginning
- Harvest aid applications
- Stripping
How can gin reports improve profit decisions?
Gin reports help you make better profit decisions because they let you check and fine-tune yield monitor data against actual ginned lint output.
They also sharpen zone-level records by factoring in things yield monitors can miss, like fiber quality, moisture, and variety traits. That gives you a clearer picture of which parts of a field bring in the best return and helps guide future input decisions.