Cotton yield forecasts can move from rough estimates to field-level planning when I combine imagery, weather, soil, sensors, and farm records. The big takeaway is simple: AI will not promise a fixed harvest number, but it can cut uncertainty early enough to help with irrigation, PGR timing, defoliation, harvest order, gin flow, and marketing.
Here’s the short version:
- Cotton yield is hard to call because weather, soil, variety, pests, and field management all shift results.
- Simple scouting and old averages miss too much at the field level.
- AI works best when it uses more than one data source, such as satellite images, drone scans, GDD, rainfall, soil maps, and in-field moisture data.
- Forecasts can start months before harvest and improve as the season moves through bloom and boll fill.
- The output should be a range, not one number, especially when storms, pests, or freeze risk show up.
- Good records matter most. Weak history in, weak forecast out.
A few numbers stand out:
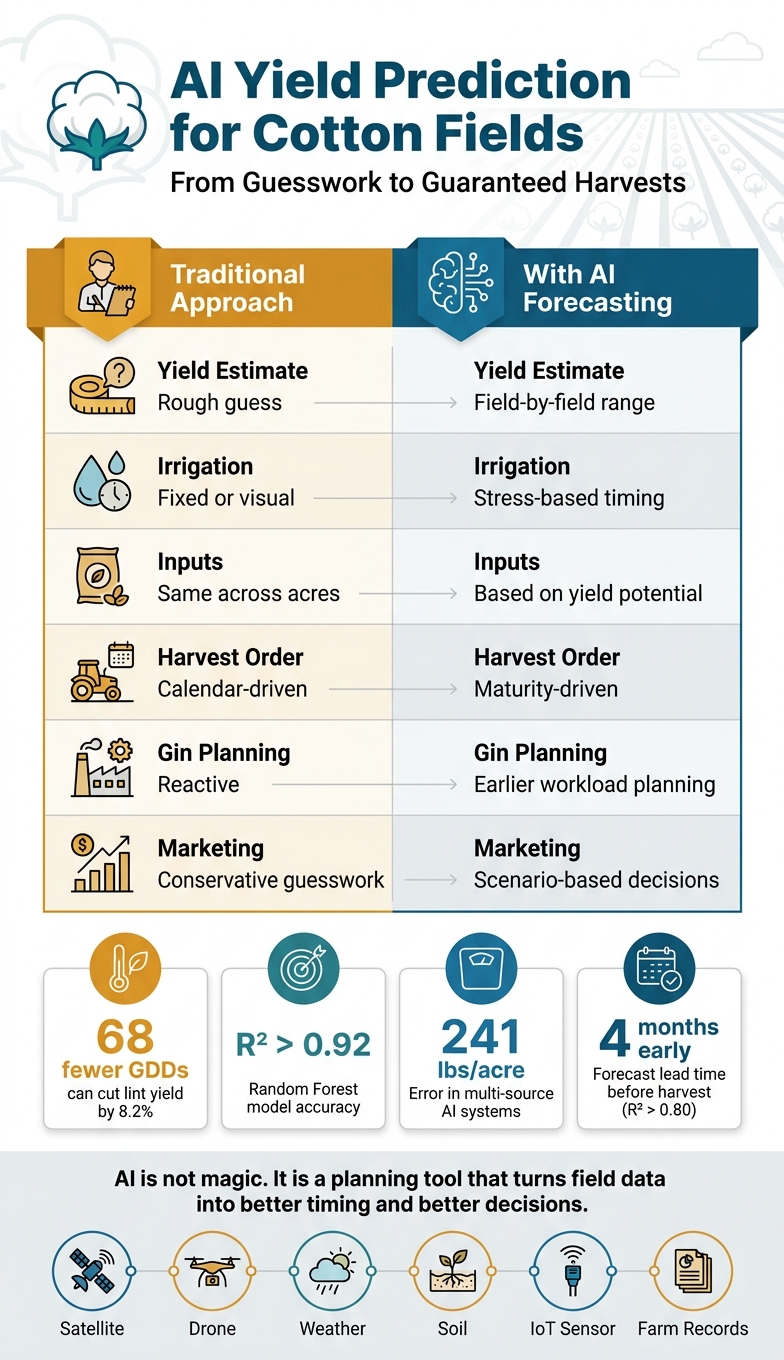
- 68 fewer GDDs can cut lint yield by 8.2%
- Some cotton forecast models reached R² above 0.80 about 4 months before harvest
- Reported error in studies fell to about 241 lbs/acre in some multi-source systems
- In other work, Random Forest models posted R² above 0.92
If I had to boil the article down to one point, it would be this: AI is not magic. It is a planning tool that turns field data into better timing and better decisions.
| What changes | Before | With AI forecasting |
|---|---|---|
| Yield estimate | Rough guess | Field-by-field range |
| Irrigation | Fixed or visual | Stress-based timing |
| Inputs | Same across acres | Based on yield potential |
| Harvest order | Calendar-driven | Maturity-driven |
| Gin planning | Reactive | Earlier workload planning |
| Marketing | Conservative guesswork | Scenario-based decisions |
That’s the shift this article explains: less guessing, more timing, and better use of field data before harvest starts.
AI vs. Traditional Cotton Yield Forecasting: Key Differences & Data-Backed Results
24-FYP-101 | AI Driven Analysis of Cotton Field for Production Estimation
sbb-itb-0e617ca
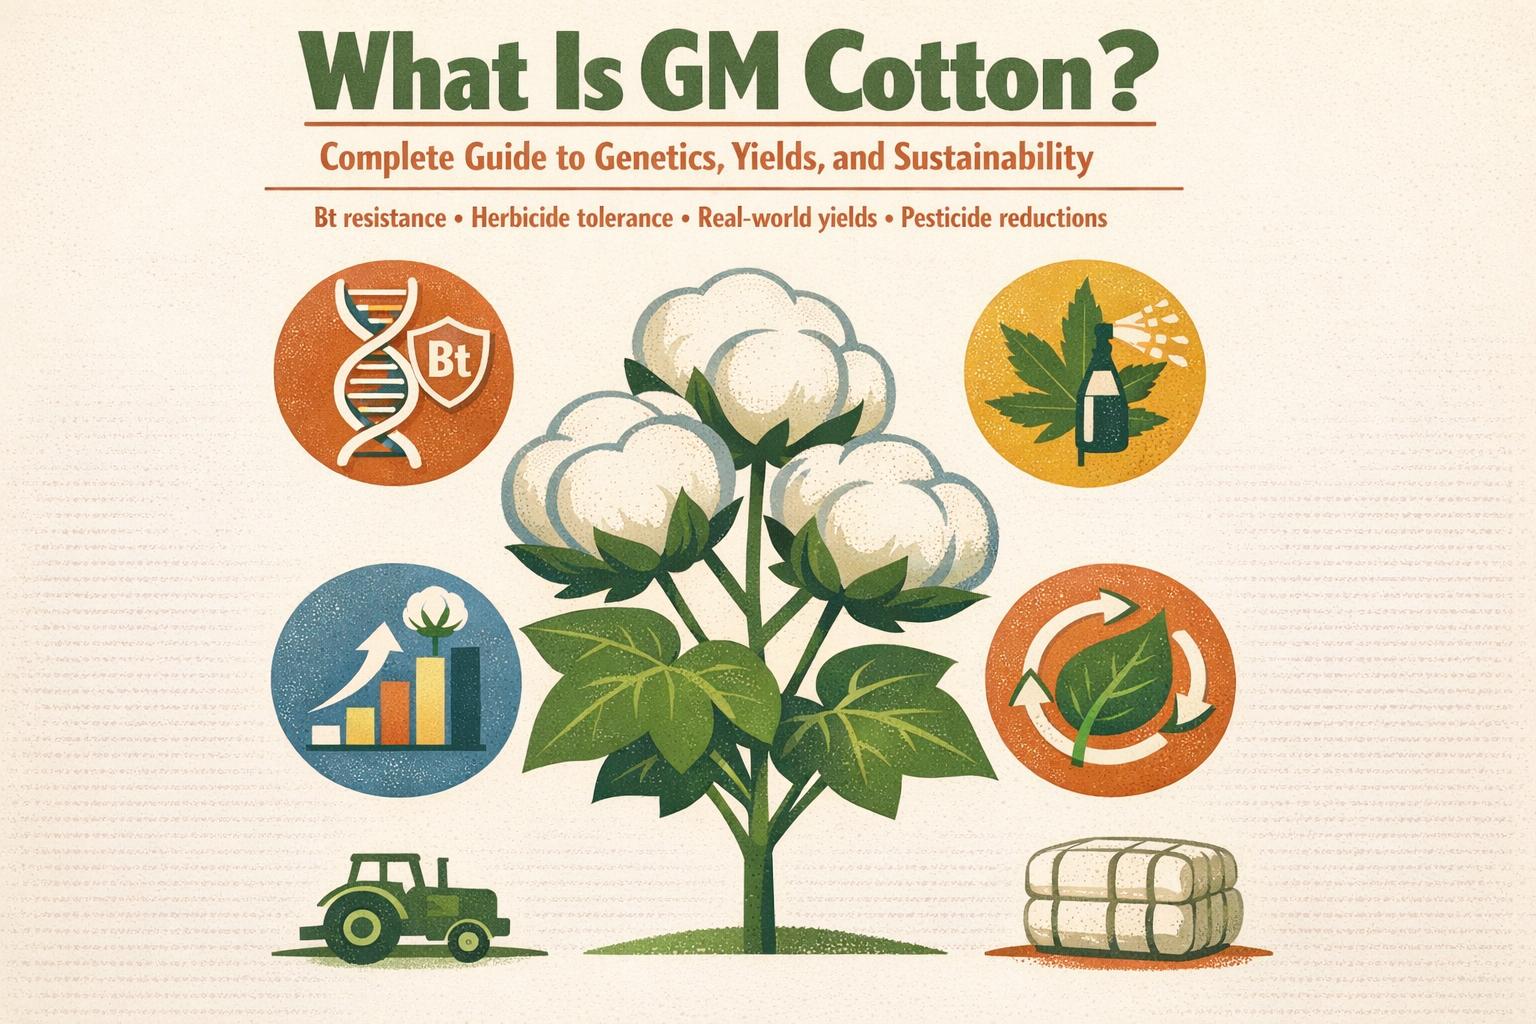
Why Cotton Yield Is Hard to Predict Accurately
Cotton yield is tough to predict because boll set and boll fill change with crop stage, weather, and field conditions. That’s why the next step has to come from field data, not county averages.
Field Variability, Weather Swings, and Management Differences
At the field level, yield comes down to boll number and boll weight. But those shift by year, variety, and even boll position on the plant. So two fields sitting side by side can react in very different ways under the same weather.
A lot goes into that gap: soil type, planting date, irrigation, variety choice, and pest pressure all play a part. USDA ARS puts it plainly: yield prediction is hard because cultivar, soil, management, pests, disease, climate, and weather interact in nonlinear ways.
Even small losses in heat units can hit output. One study found that 68 fewer GDDs can reduce lint yield by 8.2%. And when pests like boll weevils, aphids, and whiteflies show up, yield and grade can drop fast.
Where Standard Yield Estimates Break Down
Simple boll counts and visual scouting only go so far. Cotton plants don’t hold still, so to speak. Their shape and structure shift through the growth cycle, which can throw off visual yield estimates.
"Morphological characteristics of cotton plants such as general shape, branch density, or leaf area change during the growth cycle of the crop and they may mislead visual ratings of yield." - Javier Rodriguez-Sanchez, Bio-Sensing and Instrumentation Laboratory, University of Georgia
Historical averages have the same problem. A model may look strong in one season, then slip when weather changes. In one study, R² dropped from about 0.90 to 0.63–0.85 across independent years. That kind of swing is exactly why field-level AI forecasts need more than past averages.
How AI Yield Prediction Works in Cotton Fields
The Main Data Sources Behind Field-Level Forecasts
AI yield prediction works by pulling together several field data streams that show crop condition, stress, and growth stage. No single source tells the whole story. That’s why systems that combine inputs tend to beat one-source estimates. From there, the model turns growth trends, stress signals, and management history into a yield forecast.
Most field-level systems lean on six main inputs. Satellite imagery tracks canopy development with vegetation indices like EVI and LAI, which act as proxies for lint yield. Drone imagery picks up sub-field variability and can support individual boll counts at a level of detail satellites can’t reach. Weather data matters a lot, especially Growing Degree Days and precipitation, because cotton is highly sensitive to heat accumulation and water stress. Soil maps set the baseline for water-holding capacity and production limits. In-field sensors add real-time canopy temperature and soil moisture, which helps check remote sensing estimates. And farm records - planting dates, variety, irrigation, and fertilizer rates - help the model line up its forecast with what actually happened in that field.
| Data Source | Practical Value | Relative Cost |
|---|---|---|
| Satellite (Sentinel-2/Landsat) | High - best for regional planning and biomass trends | Low (often free) |
| UAV (Drone, Multispectral) | Very High - essential for boll counting and sub-field variability | High (hardware + labor) |
| Weather Stations/APIs | Critical - GDD and precipitation are primary drivers of cotton phenology | Low |
| Soil Maps (SoilGrids) | Moderate - sets baseline productivity and water constraints | Low |
| In-Field IoT Sensors | High - validates remote sensing moisture estimates | Medium |
| Farm Management Logs | High - calibrates model expectations for variety, inputs, and timing | Low |
For late-season monitoring, use EVI instead of NDVI. NDVI tends to saturate after canopy closure, which makes it less useful when the crop is fully developed. EVI holds up better in that stage and works especially well with a 12-month SPEI in yield modeling.
The Models and Tools That Turn Data Into Yield Forecasts
Once the data is in place, AI models look for patterns across seasons and fields that would be almost impossible to track by hand. Tree-based methods such as Random Forest are common in regional forecasting. In one study, a model using multispectral imagery and weather APIs posted an R² above 0.92 with an RMSE of about 371 lbs/acre.
For more complex patterns across space and time, CNN-LSTM architectures treat the season like a sequence. That matters in cotton because yield doesn’t come from a single image taken on one day. It builds over time through flowering and boll fill, and these models are built to track that progression.
Recent work using combined imagery and weather data reached an RMSE of about 241 lbs/acre. Studies also show that blending drone and satellite data can support field-level yield forecasts and even help with defoliation timing across commercial cotton operations.
These systems don’t spit out one fixed number. They return a yield range. Forecasts can come as early as four months before harvest with an R² above 0.80, then keep updating as new imagery and weather data come in. The bloom and boll-opening stages matter most for data collection, since high-resolution imagery from those windows has the strongest link to final lint weight.
The next step is turning those forecasts into decisions on water, inputs, harvest, gin flow, and sales.
How Better Forecasts Improve Farm, Gin, and Marketing Decisions
Irrigation, Input, and Harvest Decisions at the Farm Level
Once a forecast is in hand, the next step is simple: use it to make better calls. A forecast shows where irrigation and inputs are likely to pay off. That turns a rough yield guess into a field-by-field plan. Instead of treating every acre the same, growers can put more time and money into fields with the best return potential and cut back where extra inputs probably won’t pencil out.
PGR timing is one of the clearest examples. Digital tools can use early-season biomass estimates to test different PGR timing and rate scenarios, then help guide application decisions. Juan Landivar says drone and satellite data can support PGR timing, defoliation timing, and yield forecasts.
Harvest sequencing gets tighter too. Defoliation timing recommendations based on field scenarios let growers line up fields by actual crop maturity, not just by the calendar. That’s a big shift. It means harvest decisions can follow what the crop is doing in each field, instead of relying on habit or rough timing.
Gin Scheduling, Module Flow, and Regional Planning
The same forecast that helps in the field can also help at the gin. Short-range yield predictions make it easier to estimate gin workload and plan labor and throughput ahead of time.
Spatial heat maps of canopy health and cover give gins and producers a clearer picture of where production is building up. That makes logistics and day-to-day throughput planning a lot easier. A Texas Coastal Bend project used near-daily crop updates, heat maps, and termination timing recommendations to improve planning.
Marketing and Risk Management With Yield Scenarios
Yield ranges matter because they shape pricing, hedging, and contract timing. The point isn’t a single number. The value is in the range. Best-case and worst-case scenarios give growers and merchants better timing for hedging and forward contracting decisions.
| Decision Area | Standard Approach | AI-Supported Approach | Required Data | Business Benefit |
|---|---|---|---|---|
| Irrigation | Fixed schedules or visual soil checks | Stress-triggered adjustments by field zone | Canopy temperature, soil moisture sensors | Water conservation and yield optimization |
| Inputs (PGR/Fertilizer) | Uniform application across all acres | Variable rates based on biomass and yield potential | UAV multispectral imagery | Reduced input costs; higher ROI per acre |
| Harvest Timing | Calendar-based or visual inspection | Defoliation timing based on field scenarios | Satellite and drone remote sensing | Optimized fiber quality and harvest sequencing |
| Ginning | Reactive scheduling based on module arrival | Proactive labor and maintenance planning | Regional yield forecasts | Reduced labor overtime and improved throughput |
| Marketing | Spot market sales or conservative hedging | Forward contracting based on yield scenarios | 4-month lead time yield forecasts | Improved cash flow and risk mitigation |
Limits, Data Requirements, and the Best Next Step
What AI Can Improve and What It Cannot Guarantee
AI yield prediction is a planning tool, not a crystal ball. When models are trained on strong historical records and solid in-season data, they can deliver forecasts with an R² above 0.80 as early as four months before harvest. But that only works when the data going in is clean, timely, and complete.
Forecasts tend to get better after bloom, once weather patterns and crop stress data start showing how boll development is playing out. Put simply, the more complete the season picture is, the more useful the forecast becomes.
Even then, some conditions can throw things off. Hurricanes, hail, early freezes, pest outbreaks, and unusual soil conditions can push a crop beyond what the model has seen before. That’s why late-season forecasting needs updated imagery and weather inputs, not a one-and-done snapshot. AI doesn’t erase uncertainty. It cuts enough of it to help with harvest planning. The smart move is to treat outputs as ranges, not exact numbers.
That puts data discipline at the front of the line.
A Practical Adoption Path for Growers and Cotton Businesses
The biggest roadblock to better forecasting is data quality. A good place to start is with at least 10 years of yield records and soil test data. From there, layer in weather and remote-sensing data. Satellite imagery gives you broad field coverage, while UAV data can add in-field detail when clouds get in the way or satellite revisit timing falls short.
| Constraint | Impact on Forecast | Mitigation Step |
|---|---|---|
| Data Gaps | Fragmented records lead to inconsistent and unreliable yield estimates | Standardize data collection across all fields and seasons |
| Extreme Weather | Hurricanes or early freezes can devastate crops regardless of model predictions | Use probabilistic scenario ranges and update models immediately after the event |
| NDVI Saturation | Reduces sensitivity in dense, late-season canopies | Switch to EVI or MTVI for late-stage monitoring |
| Management Changes | Shifts in planting density or nitrogen rates can skew model assumptions | Run separate scenarios for planting density or nitrogen rate changes |
| Poor Historical Data | Creates algorithm bias and inaccurate regional baselines | Audit and standardize historical yield records before modeling |
Conclusion: From Rough Estimates to More Reliable Harvest Planning
Cotton yield is hard to predict because soil, weather, and management can change from one field to the next. AI helps organize that field data into forecasts that are more useful for day-to-day decisions. And the business upside is clear: tighter harvest sequencing, smarter input allocation, better gin scheduling, and better-informed marketing. That’s a big step up from guesswork.
FAQs
How early can AI predict cotton yield?
AI-based yield prediction tools can give growers an early read on the season weeks before older methods usually can. They use satellite imagery and AI models to estimate crop biomass and fiber yield early, which helps teams get a sense of where things are headed while there’s still time to act.
And this isn’t a one-and-done forecast. As more data comes in, the predictions update almost daily and get tighter over time. That gives growers a practical way to fine-tune irrigation, plan input applications, and make better calls on harvest timing.
What data do I need to get started?
Start with the key data already in your farm management platform. That usually includes:
- historical yield data
- soil test results
- crop variety details
- sensor data for soil moisture, pH, and nutrients
- satellite imagery, such as Landsat or Sentinel-2
- hyper-local weather data, including temperature and rainfall
You can also use USDA yield reports to benchmark your model's performance.
How accurate are AI cotton yield forecasts?
AI-based cotton yield forecasts can be highly accurate. Reported R2 values often fall between 0.61 and 0.98, depending on the model and the scale of the forecast. In some trials, machine learning models have reached 80% to 97.75% accuracy.
The jump can be even bigger when teams add real-time sensor data. In some systems, prediction error dropped from over 40% to about 5%. That’s a huge shift, and it shows how much good field data can matter.
That said, accuracy isn’t fixed. It still depends on a few basic things: data quality, spatial resolution, and environmental conditions. If the input data is weak or the field conditions change a lot, forecast performance can slip fast.