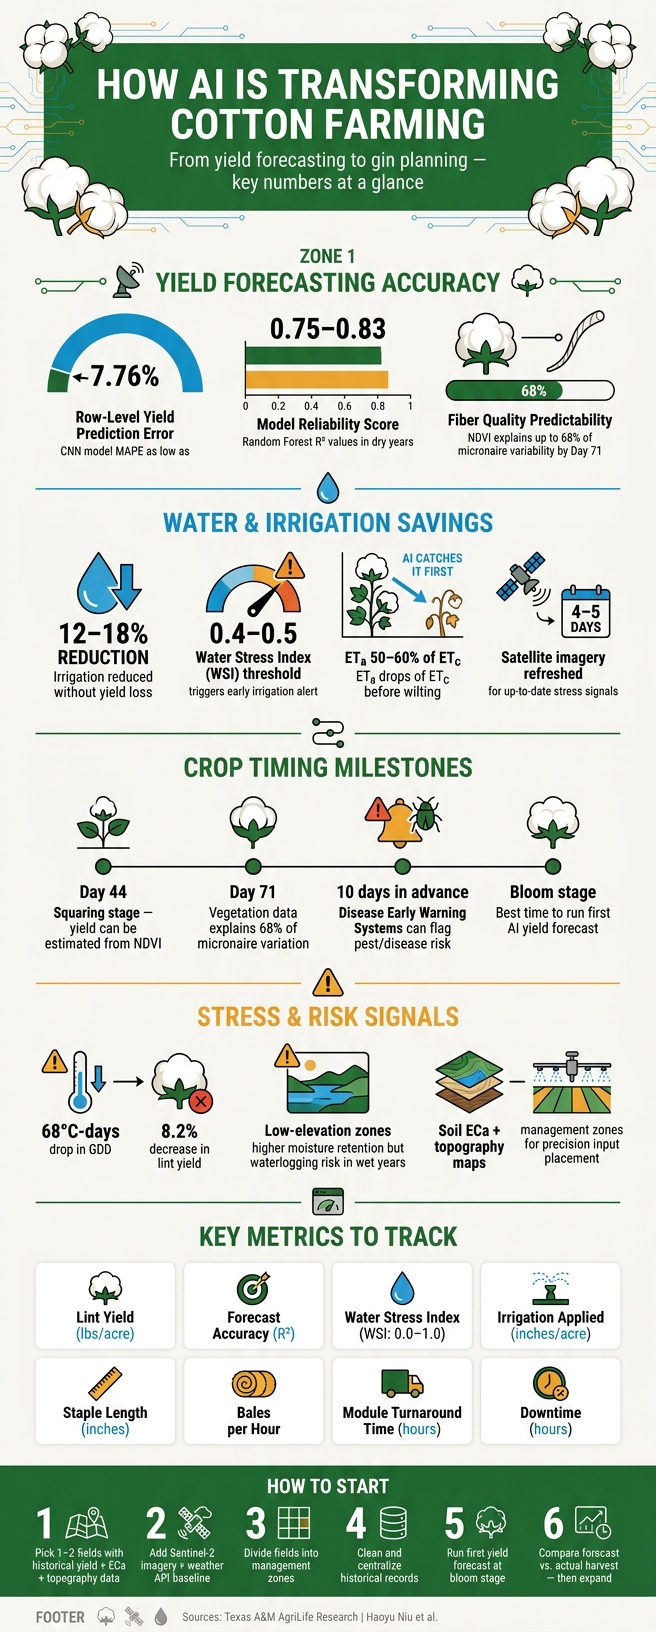
AI can help cotton growers and gin teams make better calls before problems show up. In cotton, that can mean spotting water stress earlier, forecasting yield with about 7.76% to 7.8% error in some Texas trials, and cutting irrigation by 12% to 18% without lowering yield.
If I had to sum up the article in plain English, it comes down to this:
- AI forecasts depend on data from satellites, drones, weather, soil sensors, topography, and gin records
- Growers can use those forecasts in season for irrigation, scouting, PGR timing, defoliation, and harvest planning
- Gin managers can use early yield and fiber signals to plan hauling, staffing, drying, and throughput
- A few metrics matter most: yield, forecast accuracy, water stress, irrigation applied, fiber quality, downtime, and bales per hour
- The best way to start is small: use one or two fields, clean your records, compare forecasts to harvest results, and expand from there
A few numbers stand out. Cotton growth and yield can be estimated by the squaring stage, about 44 days after planting. Vegetation data has explained up to 68% of micronaire variation by 71 days after planting. And a drop of 68°C-days in growing degree days has been tied to an 8.2% drop in lint yield.
What this means for you is simple: better data can lead to better timing. And in cotton, timing affects yield, fiber quality, water use, hauling, and gin flow.
The rest of the article explains which data matters most, how AI models use it, where the forecasts help day to day, and how to roll out a pilot without making the process too big too soon.
AI Predictive Analytics in Cotton: Key Stats & Benefits
The Data Behind Cotton Forecasts
Satellite, Weather, and Soil Data for Yield and Stress Detection
Cotton forecasts pull from satellite and UAV imagery, field weather data, and soil measurements. Each source shows a different part of the field story: plant growth, water status, heat load, and how conditions shift from one part of the field to another.
Vegetation indices like NDVI (Normalized Difference Vegetation Index) and NDMI (Normalized Difference Moisture Index) turn multispectral imagery into readable signals for canopy health, biomass, and moisture stress. In practice, that means growers can spot how the crop is developing well before harvest. These indices can estimate crop growth and lint yield by the squaring stage, about 44 days after planting.
Weather data adds another layer. Metrics such as accumulated growing degree days (AGDD), precipitation, and solar radiation help track crop development and point to stress before plants show visible symptoms. That early warning matters. A reduction of 68 °C-days in GDD (> 10 °C) has been linked to an 8.2% decrease in lint yield.
Soil data fills in what imagery and weather alone can miss. Apparent soil electrical conductivity (ECa) and elevation maps show which field zones hold moisture longer and which ones dry out first. Lower elevations usually keep more water and tend to show more stable yields in dry years, while sloped areas face more stress. When growers pair ECa with topography, they can map management zones that match field conditions more closely, which helps with input placement and irrigation timing.
Pest, Disease, and Irrigation Signals for In-Season Decisions
Once the crop is up and growing, the focus shifts from preseason planning to in-season action. At that point, models rely on signals like canopy temperature, in-field soil moisture sensor readings, and scouting images to catch trouble early.
One of the clearest irrigation signals is the Water Stress Index (WSI). When actual evapotranspiration falls to 50%–60% of potential evapotranspiration (ETc) - about a WSI of 0.4–0.5 - models flag irrigation needs before visible wilting starts. That gives growers time to act instead of waiting until stress is plain to the eye. Satellite imagery refreshed every 4–5 days keeps those signals up to date, and weekly meteorological summaries help models follow cumulative stress across growth stages.
Remote sensing also helps pick up early canopy shifts tied to pest pressure or foliar stress. Add in regional weather forecasts - humidity, temperature swings, and rainfall probability - and growers get a clearer window for targeted scouting, spray decisions, or irrigation changes before outbreaks or infections do serious damage.
Gin and Fiber Data for Throughput and Quality Planning
The same forecast stack can also help with harvest timing and gin planning. Field forecasts tell part of the story, but gin teams also need a read on quality and throughput.
HVI results - micronaire, fiber length, and fiber strength - can be predicted in part from in-season vegetation data. Research has found that vegetation indices explain up to 68% of micronaire variability as early as 71 days after planting. For gin managers, that means an early look at the kind of fiber likely to arrive.
On the equipment side, tracking gin temperature, humidity, runtime, and energy use helps operators spot bottlenecks before they turn into downtime or fiber damage. When field-level yield forecasts are matched with HVI projections and equipment performance data, throughput planning becomes far less reactive.
Use the table below as a quick reference for how each data source connects to a field or gin decision.
| Data Source | Key Metric | What It Reveals |
|---|---|---|
| Satellite/UAV | NDVI, NDMI, Land Surface Temp | Canopy health, moisture stress, heat exposure |
| Weather API | AGDD, ET, Rainfall | Heat unit accumulation, water demand, stress timing |
| Soil Sensors | ECa, Soil Moisture | Root-zone water availability, field variability |
| Topography | Elevation, Slope | Moisture retention zones vs. drought-prone areas |
| Gin/Fiber | HVI (Micronaire, Fiber Length, Strength) | Fiber quality prediction and processing risk |
sbb-itb-0e617ca
Where AI Adds Practical Value in Cotton Operations
Yield Forecasting and Field-Level Decision Support
Machine-learning models can turn field data into zone-level yield forecasts. In dry years, Random Forest models have reached R² values between 0.75 and 0.83. That’s strong enough to help with in-season calls, not just post-season analysis.
If a model marks one zone as underperforming early, a grower doesn’t have to treat the whole field the same way. They can shift irrigation, change fertilizer placement, or send scouts to that part of the field first. That kind of field-by-field, or even zone-by-zone, guidance is where AI starts to pay off.
At the row or grid level, CNN-based models have predicted cotton yield with a Mean Absolute Percentage Error (MAPE) as low as 7.76%. That level of precision can help with module placement and hauling plans. Texas A&M's digital agriculture work also shows how daily crop maps can guide PGR timing, defoliation timing, and harvest planning. Those same signals can point to crop stress early, before losses are easy to spot in the field.
Early Risk Detection for Weather, Pests, and Crop Stress
AI helps most when it gives an earlier warning. Manual scouting often finds problems once they’re visible. Predictive models can spot signs while the problem is still building, sometimes days or weeks ahead.
Here’s how that looks in practice:
| Risk Factor | Detection Method | Recommended Action |
|---|---|---|
| Drought / Water Stress | WSI reaches 0.4–0.5; ETa drops to 50–60% of ETc | Adjust irrigation; prioritize moisture-retaining zones |
| Heat Stress | Cumulative GDD tracking | Monitor for maturity delays; revise harvest timing |
| Pest Pressure | NDVI anomalies; historical infestation patterns and field-level data gaps | Targeted scouting for boll weevils, aphids, or whiteflies |
| Storm / Flood Risk | Real-time weather data; topography mapping | Check low areas for waterlogging and quality loss |
| Yield Shortfall | Random Forest / CNN forecasting | Update scouting, hauling, and staffing plans |
Topography matters more than many growers think. Low-elevation zones and depressions may hold moisture well in dry years, then become waterlogging trouble spots in wet years. When AI layers elevation data with real-time precipitation alerts, it can flag those areas before standing water hurts roots or keeps equipment out of the field. From there, the job shifts to using those forecasts to plan harvest and gin intake with fewer surprises.
Harvest, Hauling, and Gin Planning Based on Predicted Crop Volume
Once yield is forecast, the same model can help shape harvest, hauling, and gin schedules. Late-season models sharpen defoliation timing and lint-yield forecasts, which makes planning less of a guessing game.
| Growth Stage | Typical Crop Coefficient (Kc) | AI Planning Focus |
|---|---|---|
| Initial | 0.35–0.50 | Early season biomass estimation |
| Crop Development | 0.70–0.85 | PGR timing and rate adjustments |
| Mid-Season | 1.15–1.20 | Peak water stress monitoring |
| Late Season | 0.60–0.40 | Defoliation timing and lint yield forecasting |
Predicted crop volume also helps gin-adjacent operations line up module hauling routes, adjust staffing, and make drying calls based on expected moisture levels and harvest timing. When growers and gins work from the same forecast data, they can make those moves earlier instead of scrambling at the last minute.
"Accurate yield prediction will be very beneficial to the cotton production... especially in balancing water availability with yield optimization." - Haoyu Niu et al., Researchers at Texas A&M University
Tools, Metrics, and Steps to Get Started
Tool Categories Used in Cotton Predictive Analytics
Once your data feeds are set up, the next move is picking tools that turn raw numbers into forecasts and alerts. The point isn't to pile up more data. It's to make earlier, better calls on irrigation, harvest timing, and gin throughput.
Satellite platforms such as Landsat 8 and Sentinel-2 can derive NDVI, NDMI, and Land Surface Temperature for large-scale yield and crop-stress forecasting. If you want a closer field view, UAV platforms with multispectral sensors can help with boll counts, canopy stress maps, and field-level yield forecasts.
Imagery helps a lot, but it doesn't tell the whole story. Weather APIs and historical weather datasets fill in temperature, precipitation, and evapotranspiration data that satellite images miss. It's also smart to pair those inputs with soil-moisture sensors installed about 16 inches deep so you can check field conditions against what the model is saying.
For pest and disease pressure, Disease Early Warning Systems can flag elevated risk from local weather patterns up to 10 days in advance. And on the gin side, dashboards can tie together field health, treatment records, and bale data so planning is based on what is happening in the field, not guesswork.
Key Metrics to Track: Yield, Water Use, Fiber Quality, and Downtime
Track a small set of KPIs from the start. That gives you a clean way to compare model output with what happened in the field and at the gin.
| KPI Name | Unit | Why It Matters | Who Should Track It |
|---|---|---|---|
| Lint Yield | lbs/acre | Main measure of productivity and profit | Growers & Gin Managers |
| Forecast Accuracy | R² | Shows whether AI models are dependable enough to use | Growers & Data Analysts |
| Water Stress Index (WSI) | 0.0–1.0 | Shows when irrigation action may be needed | Irrigation Managers |
| Irrigation Applied | inches/acre | Tracks water-use efficiency through the season | Growers |
| Staple Length | inches | Affects fiber grade and market price | Growers & Buyers |
| Module Turnaround Time | hours | Measures hauling and ginning logistics | Gin Managers |
| Bales per Hour | bales/hr | Tracks ginning throughput and use of capacity | Gin Managers |
| Downtime | hours | Helps spot mechanical or scheduling bottlenecks at the gin | Gin Managers |
Use R² and RMSE to judge whether a forecast is dependable enough to act on.
A Step-by-Step Rollout Plan for Growers and Gin Operators
Start small. Pick one or two fields with historical yield records, soil ECa maps, and topographic data. Then use Sentinel-2 imagery and a weather API to build your baseline. Before you add machine-learning models, divide the fields into management zones based on topography and soil variability.
After that, clean and centralize your historical records so the model is working from solid input data. Field staff should handle ground-truth checks, keep spray and irrigation records current, and manage mobile data entry. If that part gets sloppy, the forecast will too.
Next, connect your weather and imagery feeds and run your first yield forecast during the bloom stage, when crop appearance is strongly tied to final yield. Then compare the forecast with actual harvest results. In one cotton irrigation model, combining satellite and weather data cut total water application by 12–18% without hurting yield.
Use the pilot to decide where to expand next: which fields, which zones, and which gin processes are worth bringing into the system first.
24-FYP-101 | AI Driven Analysis of Cotton Field for Production Estimation
Conclusion: Turning Better Forecasts into Gains in Yield, Quality, and Profitability
AI starts to pay off when satellite, weather, soil, scouting, and gin data come together in one forecast people can actually use. When that happens, growers and gin operators get an earlier read on problems that may be building weeks ahead. That extra time matters. It gives them a chance to step in before yield drops or fiber quality slips.
But there’s a catch: the forecast has to match what’s happening in the field.
Forecasts only have value when teams check them against local field data each season. Ground-truth checks, soil moisture sensors, and manual boll counts help keep models tied to actual conditions instead of assumptions. When that match is there, forecasts become far more useful for harvest timing, hauling, and gin intake planning.
Recent Texas A&M AgriLife work with Texas Coastal Bend producers shows what this can look like in practice. Their work points to how integrated drone and satellite data can help with plant growth regulator timing, defoliation, lint-yield forecasts, and gin planning.
The path ahead is pretty direct: validate forecasts every season, then connect field predictions to gin planning. That’s where the payoff shows up - in lower input costs, better fiber quality, and a gin that stays near capacity.
FAQs
What data do I need to start using AI in cotton?
Start with both historical and real-time data. The main inputs are historical yield data, crop calendar information, and weather data.
For field monitoring, use remote sensing data such as satellite or UAV multispectral imagery to calculate NDVI and check crop health and canopy cover. Topography and soil electrical conductivity (ECa) also help explain field-level differences.
How accurate are AI cotton yield forecasts in real conditions?
AI-powered cotton yield forecasts can be highly accurate in field conditions. Recent studies report R² values above 0.90, accuracy as high as 97.75% for integrated models, and about 80% in regional projects.
Results can shift with moisture levels, with models often doing better in dry years than in wet seasons. Even so, these tools tend to beat older forecasting methods because they combine soil data, satellite vegetation indices, and local weather patterns.
Can AI help small cotton operations, or just large ones?
Yes. AI can help small cotton farms, not just big ones.
Satellite imagery gives you the big picture. UAVs, on the other hand, can show much more detail, which makes them a good fit for smaller operations.
Used well, these tools can help farmers:
- fine-tune inputs
- cut labor needs
- lower operating costs
- make better in-season decisions
That can happen through tools like digital hubs, mobile apps, and field sensors.